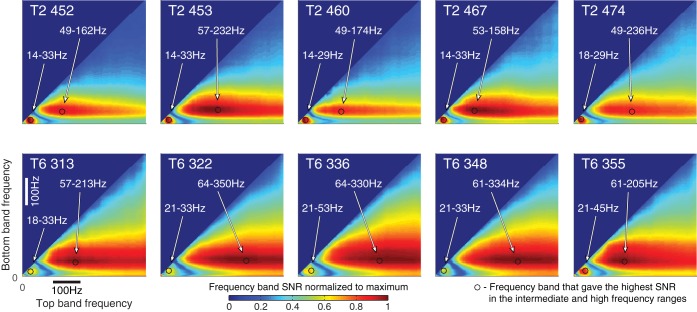
Fig. 3.
Signal-to-noise ratio (SNR) for five collection sessions, identified by number, for both participants (T2 and T6), averaged over all channels, which have been used to determine intermediate- and high-frequency component (IFC and HFC, respectively) frequency bands. SNR has been normalized to the maximum value for each session. The black circles mark the frequency band that gave the highest SNR in the intermediate- and high-frequency ranges.

