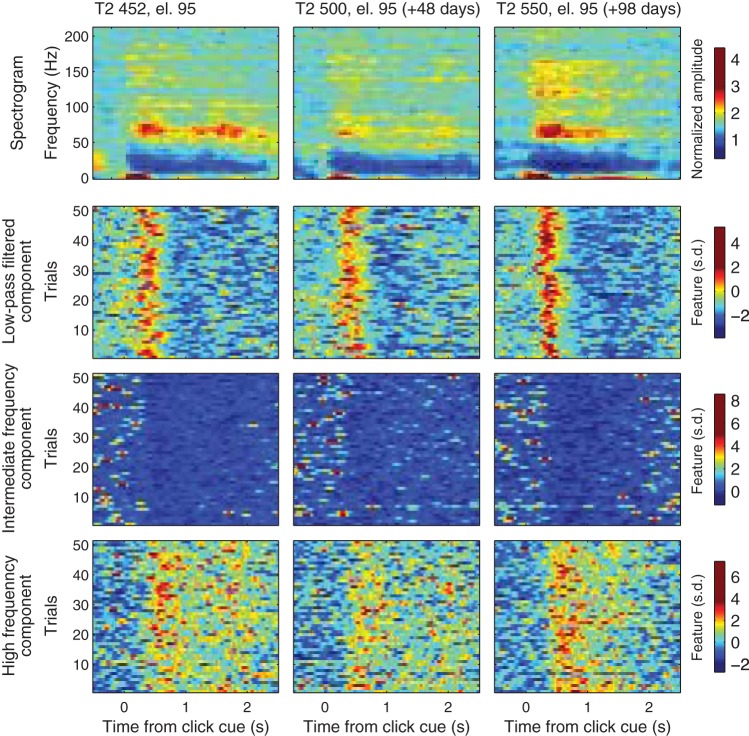
Fig. 5.
Examples of participant T2’s neuronal responses to attempts to squeeze his right fist recorded on a single electrode (el. 95) during three open-loop calibration blocks for three sessions 48 or more days apart. Panels show average spectrogram (top row) and single trials of low-pass filtered (second row), intermediate-frequency (third row), and high-frequency (bottom row) component LFP features. Single trials are shown in units of standard deviation (s.d.). For better visualization, the colorbar scale spans the values from 0.5th to 99.5th percentile.

