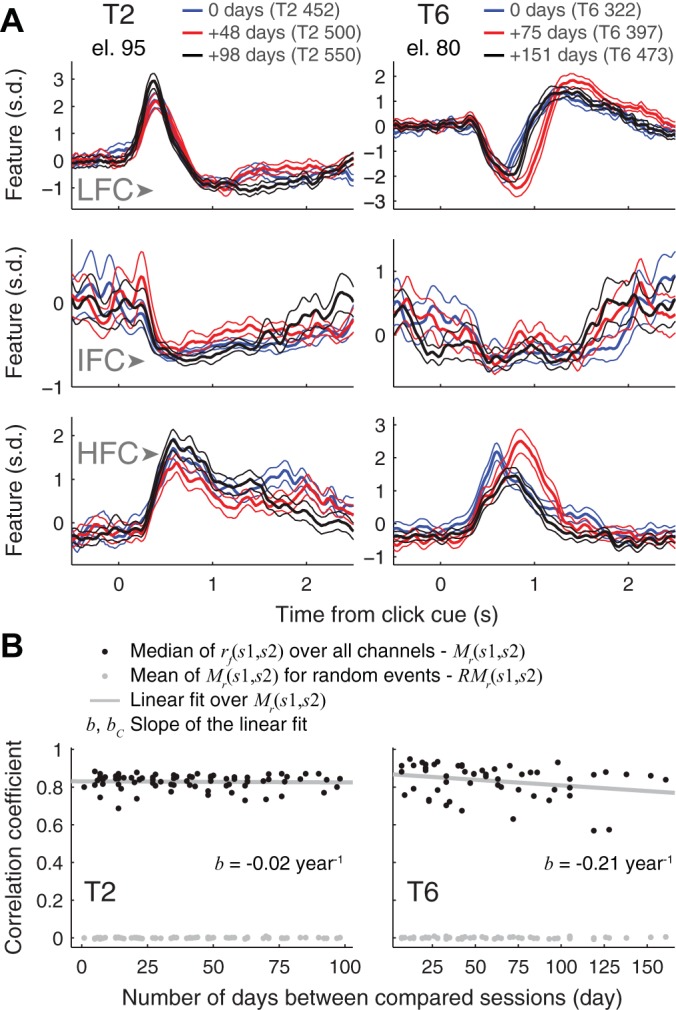
Fig. 6.

Long-term stability of participants’ local field potential (LFP) responses during click actions. A: mean (thick lines) and 95% confidence intervals (thin lines) of single electrode low-pass filtered component (LFC; top), intermediate-frequency component (IFC; middle), and high-frequency component (HFC; bottom) LFP features calculated over all trials recorded in open-loop calibration blocks are shown for three selected sessions at least 1 mo apart (blue, red, and black traces in temporal order). Left and right: signals for participant T2, electrode 95; and participant T6, electrode 80, respectively. Average spectrograms and single-trial LFP responses for these sessions are shown in Fig. 5. s.d., Standard deviation; el., electrode. B: black dots show the median of single-feature cross-session LFP response correlation coefficients [rf(s1,s2)] over all channels for all compared session pairs s1 and s2 against the intersession period. Gray dots show the mean Mr(s1,s2) when the LFP responses are triggered on random events. Gray lines show the linear ordinary least squares fit to Mr(s1,s2) with the slope b shown at the bottom of the panel.
