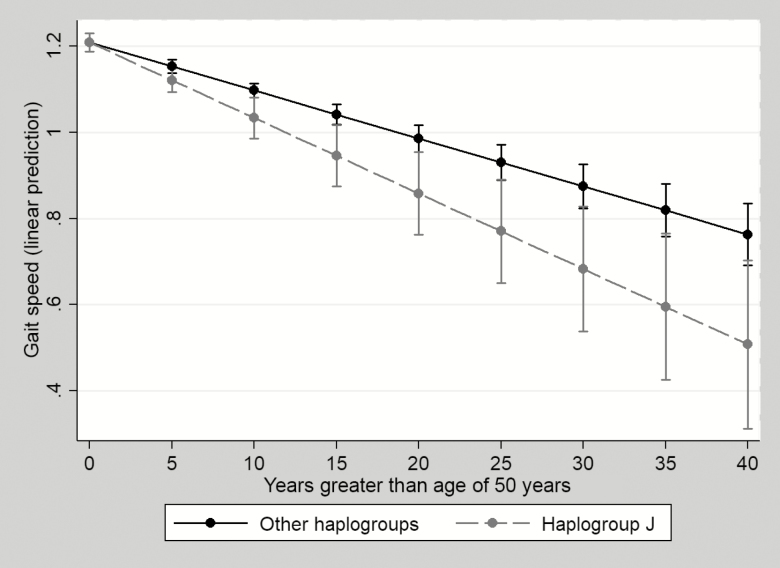
Figure 1.
Adjusted predictions of gait speed decline by haplogroup J with 95% confidence intervals. Statistics presented in Table 2 and Supplementary Table 1. Model adjusted for hepatitis C virus infection, AIDS diagnosis, log10 viremia copy-year, college education, cigarette smoking, peripheral neuropathy, weight, height, and time-varying exposure to thymidine analogues (ever vs never).

