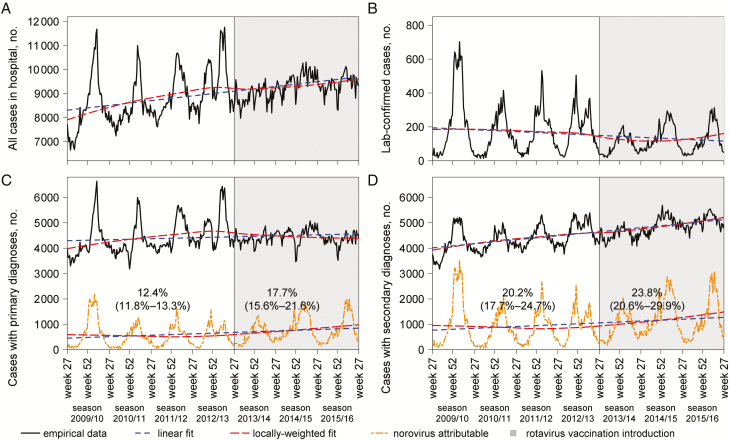
Figure 1.
National hospital statistics for inpatients with infectious and noninfectious gastrointestinal (primary and secondary) diagnoses and laboratory-confirmed cases of norovirus in England, July 2009 to June 2016, visualizing norovirus-attributable proportions using linear regressions fitted to the data before and after July 2013. Reported values are the mean and 95% confidence interval (in brackets).

