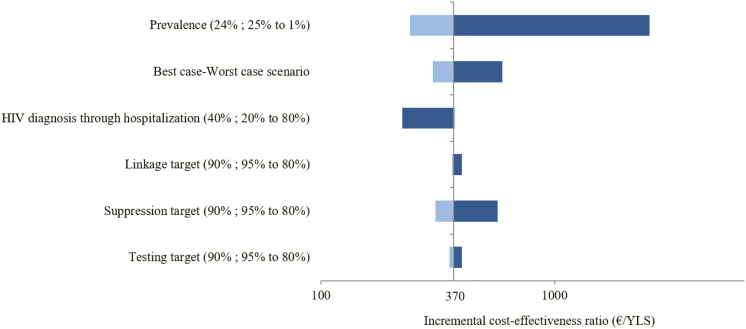
Figure 3.
One-way and scenario sensitivity analysis (tornado diagram). In a 1-way sensitivity analysis, we assess the change in the incremental cost-effectiveness ratio (ICER) of the combined intervention compared with the base case by varying 1 parameter at a time. Each parameter shows the base case value; range tested in parentheses. The worst-case scenario examines the ICER if all interventions achieve the lower efficacy estimate (testing, linkage, and suppression targets: each 0.8), and the best-case scenario examines the ICER if all interventions achieve the higher efficacy estimate (testing, linkage, and suppression targets: each 0.95). Abbreviations: HIV, human immunodeficiency virus; YLS, years of life saved.

