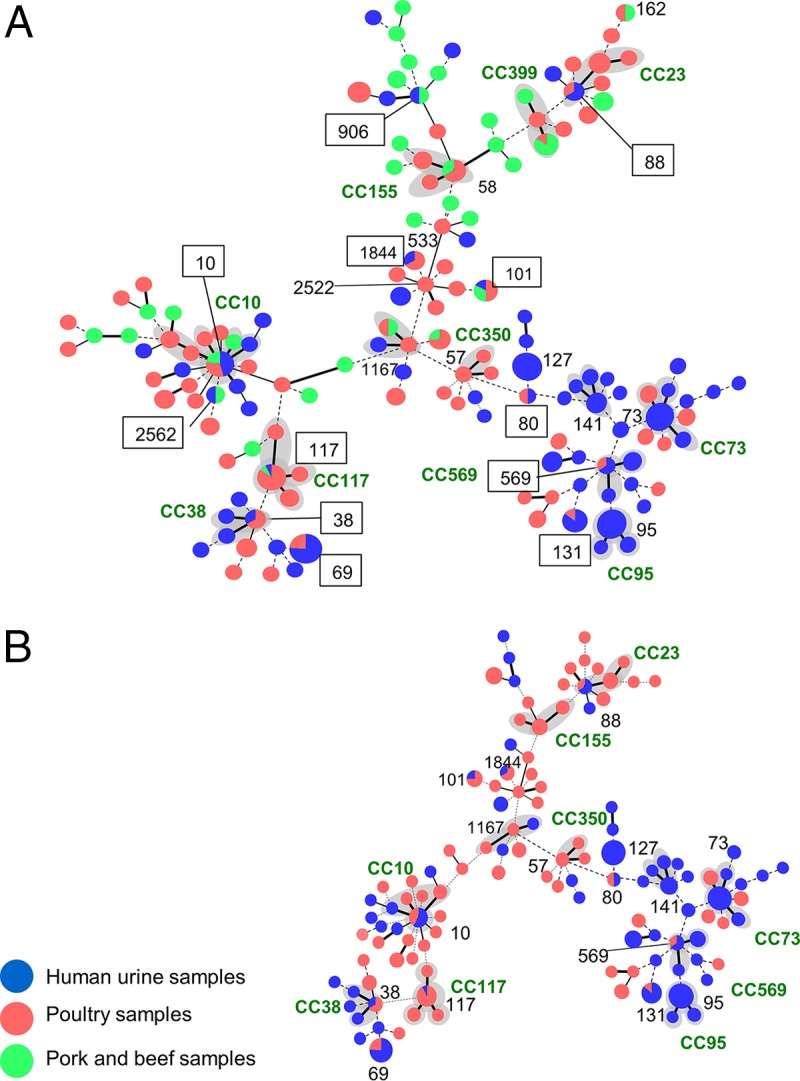
FIG 4 .

Population snapshot of E. coli isolates obtained in Northern California from patients suspected to have UTIs seen at the university health service and retail meat products. Genetic relationships among 395 E. coli isolates from human urine samples and retail meat products were visualized by the goeBURST algorithm based on the PHYLOViZ software (http://www.phyloviz.net/). Each circle represents a distinct genotype; the size of a circle is proportional to the number of isolates. Representative STs are shown as numbers without the ST prefix. The numbers in squares represent the shared genotypes (sequence type without the ST prefix) between urine and meat E. coli isolates. STs that are single-locus variants are connected with thick black lines. STs that are double-locus variants are connected with thin black lines. STs that are different at three or more loci are connected with dotted lines. Gray shading indicates that more than two STs belong to one clonal complex. (A) Isolates from three source groups (human urine samples, poultry meat samples, and pork and beef samples). (B) Isolates from two source groups (human urine samples and poultry meat samples).
