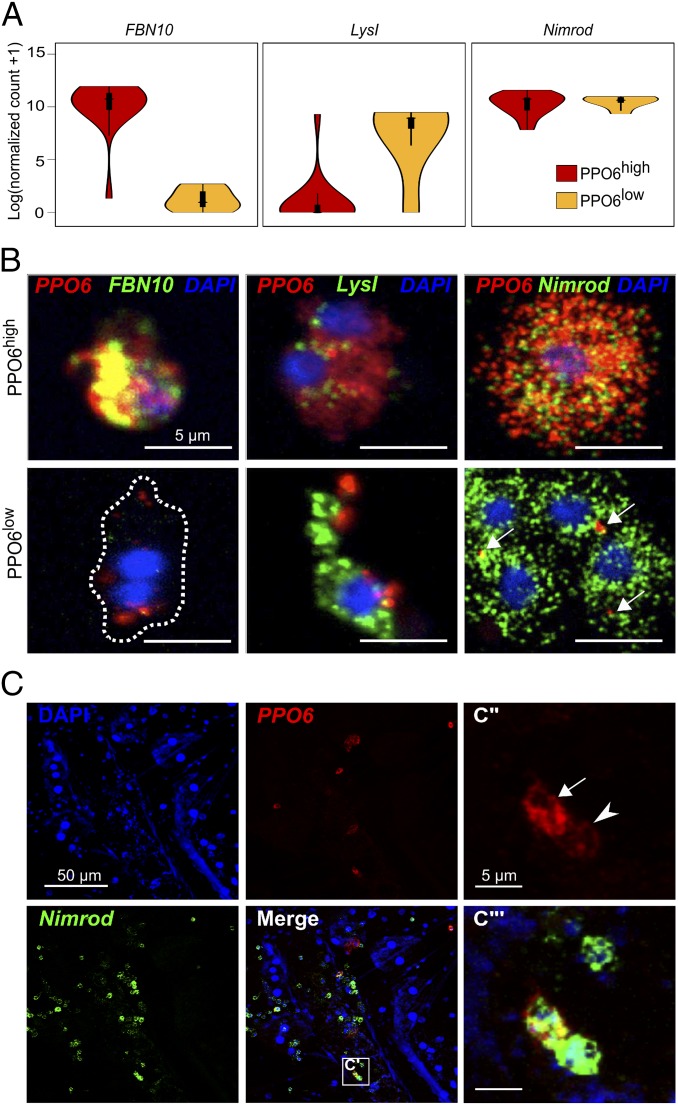
Fig. 3.
Characterization of PPO6high and PPO6low cell subpopulations. (A) Violin plots of the expression of putative population and panhemocyte markers. (B) RNA-FISH validation of identified PPO6high and PPO6low cell subpopulations in perfused cells based on markers shown in A. Cells were classified as PPO6high (Upper) or PPO6low (Lower) according to the expression of PPO6 (red). Arrows indicate lower PPO6 signal. (C–C‴) PPO6high and PPO6low cell subpopulations can also be seen as tissue-resident blood cells attached to the inner abdominal wall of female mosquitoes. Arrow and arrowhead indicate PPO6high and PPO6low cell subpopulations, respectively. C‴ shows higher amplification of the C′ boxed area. (Scale bars: B, 5 µm; C and C′, 50 µm; C″ and C‴, 5 µm.) DNA is stained with DAPI.

