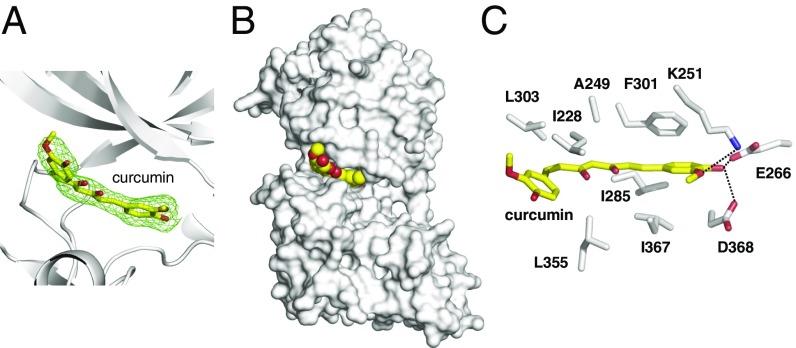
Fig. 2.
Structure of DYRK2 in complex with curcumin. (A) The Fo–Fc difference electron density map (2.5 σ) calculated before curcumin was modeled is shown as a green mesh, revealing the presence of curcumin. (B) Curcumin occupies the ATP-binding pocket of DYRK2. Curcumin atoms are shown as yellow and red spheres. DYRK2 is shown in a surface representation. (C) Detailed interactions between DYRK2 and curcumin. Hydrogen bonds are shown as dashed lines.

