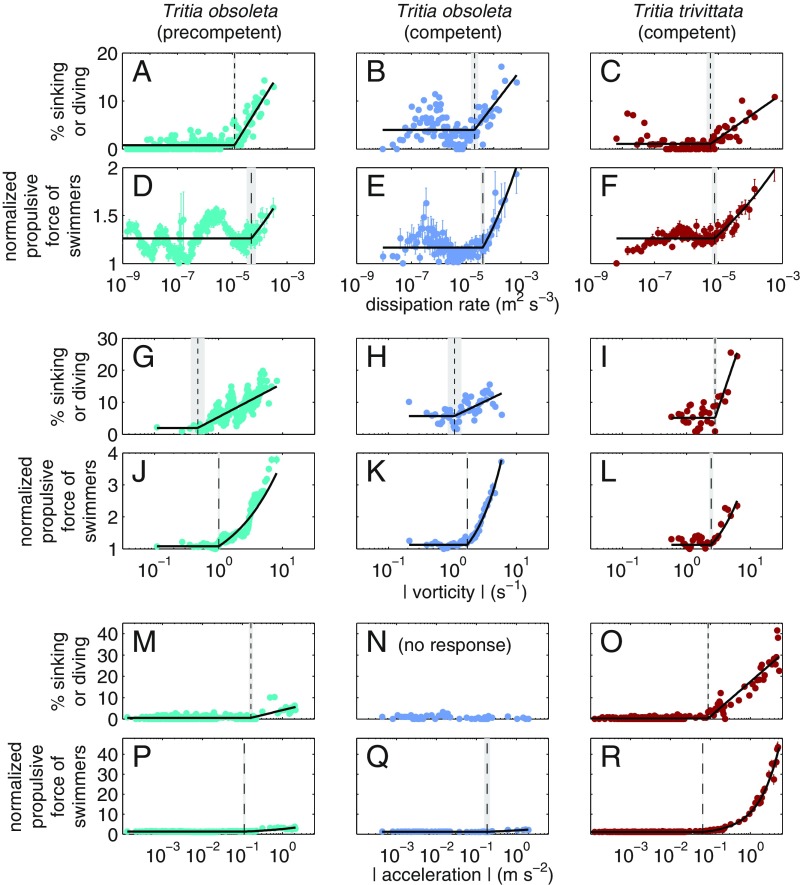
Fig. 2.
Proximate larval responses to turbulence, tilt-inducing vorticity, and waves. Included is the percentage of larvae sinking or diving (A–C, G–I, and M–O) and the propulsive force of swimming larvae normalized by the minimum value (D–F, J–L, and P–R) vs. dissipation rate in grid-stirred tank (A–F), vs. magnitude of tilt-inducing vorticity in the cylinder rotating about a horizontal axis (G–L), and vs. magnitude of side-to-side acceleration in shaker flask oscillating horizontally (M–R). Turbulence experiments produced large dissipation rates, strain rates, and vorticities, but accelerations were small; rotating-cylinder experiments produced large vorticities and moderate centripetal accelerations, but strain rates were negligible; shaker flask experiments produced linear wave motions with large accelerations, but vorticity and strain rate were negligible (SI Appendix, Fig. S2). Symbols are percentages or means SE of instantaneous observations within small bins ( except in G, H, J, K) of , , or at larval locations. Solid lines are the fitted piecewise model, and vertical lines and shaded regions indicate threshold signal SE identified by piecewise model fit (SI Appendix, Table S3). For propulsive force, the model was fitted to log10 (SI Appendix, Figs. S3, S6, and S8); here the fitted is normalized by minimum observed , and when converted from to linear scale, the linear model fit is curved.

