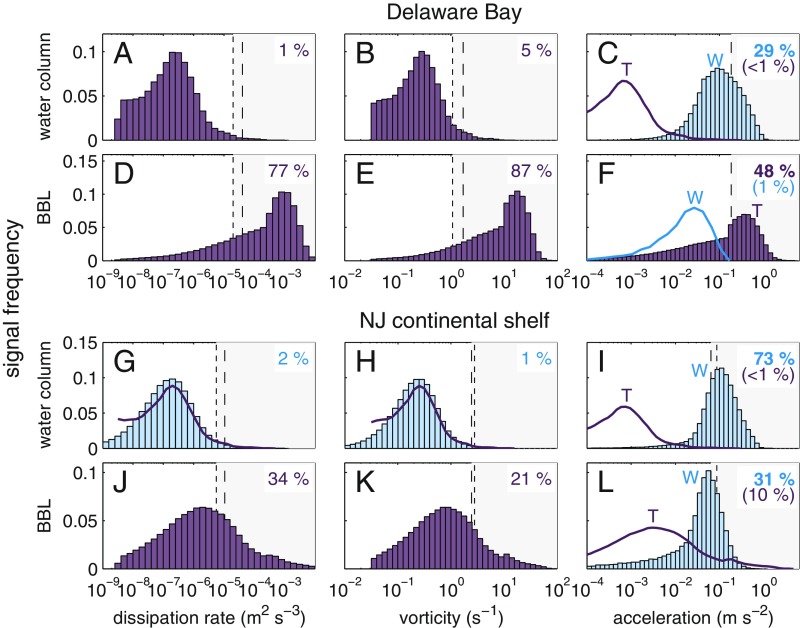
Fig. 3.
Frequency distributions of behavior-inducing physical signals in snail habitats (SI Appendix, Methods: Environmental Data Analysis). Included are dissipation rate (A, D, G, and J), vorticity SD (B, E, H, and K), and acceleration SD (C, F, I, and L) in the water column (A–C and G–I) and BBL (D–F and J–L) of Delaware Bay (A–F; T. obsoleta habitat) and the New Jersey continental shelf (G–L; T. trivittata habitat). Values are computed from hydrodynamic model (purple histograms and lines) and buoy data (blue histograms and lines). Dissipation rates (A, D, G, and J) and vorticities (B, E, H, and K) are turbulence generated; accelerations are generated by turbulence (T) or waves (W) as indicated by labels (C, F, I, and L). Accelerations are dominated by turbulence in the BBL of Delaware Bay (F; purple histogram) and by waves everywhere else (C, I, and L; blue histograms). Numbers indicate percentages of signals exceeding larval thresholds for increased sinking/diving (dotted lines) or swimming effort (dashed lines) of T. obsoleta in Delaware Bay (A–F) and of competent T. trivittata on the New Jersey continental shelf (G–L). For accelerations, text colors indicate above-threshold signal percentages associated with turbulence (purple) and waves (blue), and upper values in boldface type correspond to the dominant process.

