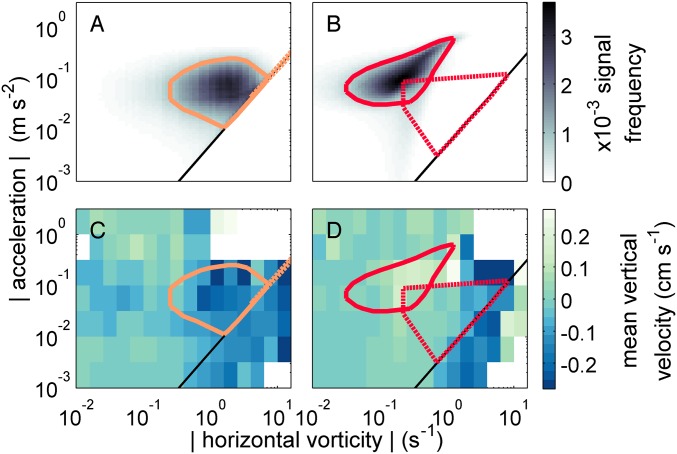
Fig. 4.
Observed physical signals in snail habitats and behaviors of competent larvae, with reference to signals typical of their adult habitats. (A and B) Joint frequency distributions of vorticity SD and acceleration SD in Delaware Bay (A, T. obsoleta habitat) and on the New Jersey shelf (B, T. trivittata habitat). Shading indicates normalized frequency of signals in the upper of the water column (SI Appendix, Methods: Environmental Data Analysis); black lines indicate theoretical signal range in isotropic turbulence. Colored polygons are convex hulls enclosing the 75 most frequently co-occurring signals in the water column (solid lines) and benthic boundary layer (dashed lines) of Delaware Bay (orange; A and C) and the New Jersey shelf (red; B and D). (C and D) Mean behavioral vertical velocities of competent larvae from inlets and estuaries (C, T. obsoleta) and from the shelf (D, T. trivittata) across gradients of co-occurring turbulence- and wave-generated signals. Instantaneous observations of larval velocity are combined from multiple experiments and averaged over bins of instantaneous acceleration and vorticity magnitude at larval locations. Colored lines are as in A and B.

