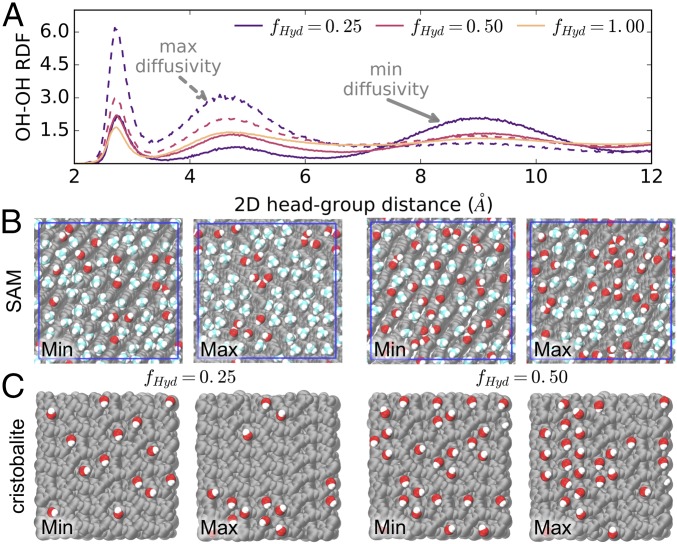
Fig. 3.
(A) The 2D radial distribution functions for SAM hydrophilic groups show that maximum diffusivity cases strengthen spatial correlations at short distances. Solid lines for RDFs indicate minimum diffusivity surfaces, while dashed lines give maximum diffusivity cases. (B and C) Simulation snapshots of the minimum and maximum diffusivity patterns for (B) SAM and (C) cristobalite surfaces at hydroxyl fractions of 0.25 and 0.50. Clustering of hydroxyl groups (shown in red) on maximum diffusivity surfaces is clear from visualization of surface structures.

