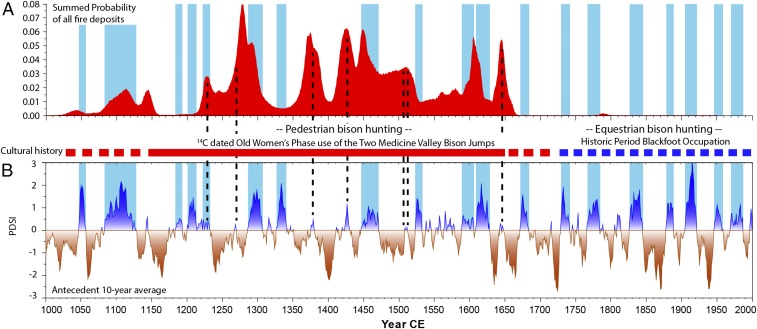
Fig. 3.
Summed probability distribution of radiocarbon dates for fire deposits from KAP 2 and KAP 4 (A) compared with decadal variability in PDSI by using 10-y averages of antecedent moisture conditions (27), a proxy for fuel production (B). Decadal-scale pluvial episodes are indicated by vertical blue bars. Dashed vertical black lines indicate short, mild wet periods that correspond to peaks in the fire probability distribution.

