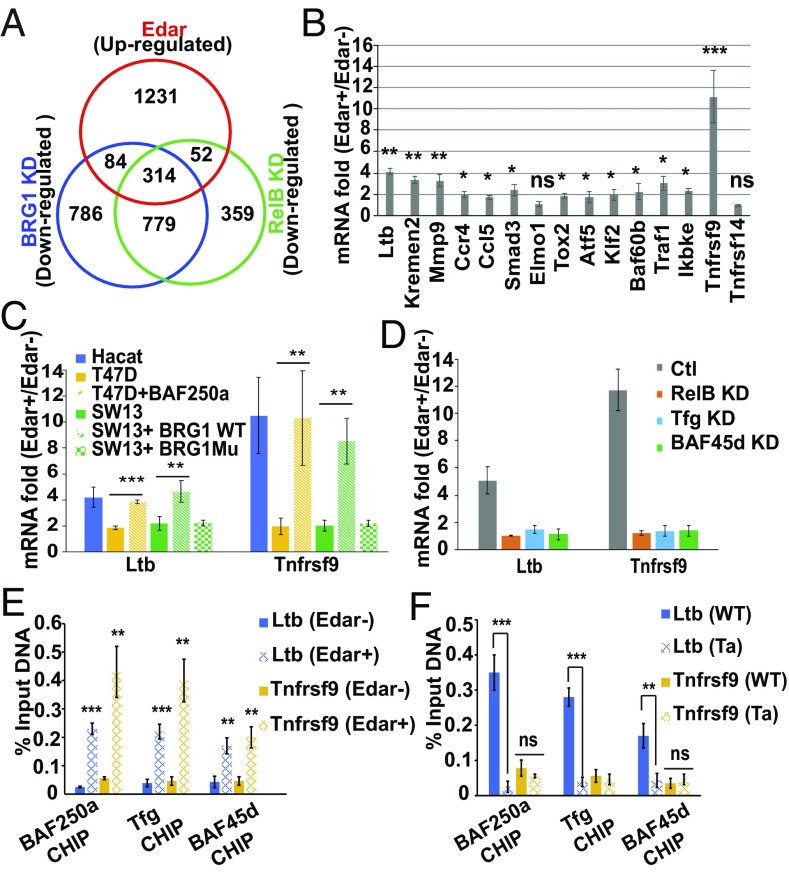
Fig. 5.
Identification of gene targets regulated by both the BAF complex and Eda signaling. (A) Venn diagram showing the number of genes significantly up-regulated by Eda/Edar stimulation (red), down-regulated by BRG1 KD (blue), or down-regulated by RelB KD (green). (B) qPCR assays show the mRNA fold (Edar+/Edar−) of selected genes. (C) qPCR assays show the levels of Ltb and Tnfrsf9 in cell lines with or without indicated vector transfection. BRG1Mu, mutated Brg1. (D) qPCR assays show the levels of Ltb and Tnfrsf9 in HaCaT cells transfected with scrambled siRNA (Ctl) or siRNA (KD) against RelB, Tfg, or BAF45d, respectively. (E) CHIP-qPCR assays show the Ltb or Tnfrsf9 promoter-binding activity of BAF250a, Tfg, and BAF45d. Chromatin from Edar− or Edar+ cells treated with Eda CM was used. (F) As described in E, except that chromatin from eyelids of E16.5 WT or Tabby mice were used. Two percent chromatin DNA was used as input. Error bars indicate mean ± SEM for triplicates. *P ≤ 0.05, **P ≤ 0.01, and ***P ≤ 0.001 by Student’s t test; ns, no significant change.

