Fig. 1.
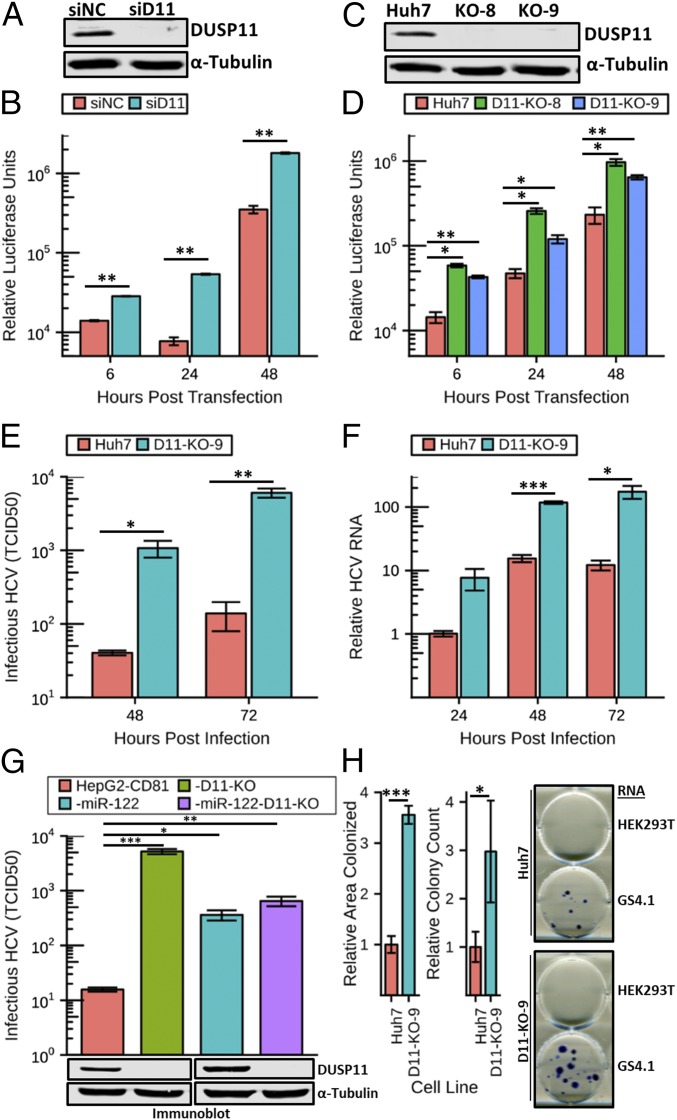
Reducing DUSP11 levels enhances HCV replication and infection. (A) Confirmation of siRNA knockdown of DUSP11 in Huh7 cells by immunoblot. Huh7 were transfected with either an irrelevant control siRNA (siNC) or DUSP11-specific siRNA (siD11). Cell lysates were harvested 48 h post transfection and assayed by immunoblot with the indicated antibodies. (B) sgJFH1-Rluc replicon luciferase assay in Huh7 cells treated with siNC or siD11. Luciferase assays were performed at the indicated times post replicon RNA transfection. The mean ± SEM of three individual experiments is presented. (C) Confirmation of CRISPR/Cas9 disruption of DUSP11 in Huh7 cells by immunoblot. Lysates from parental Huh7 cells and two independent DUSP11 knockout clones (D11-KO-8 and D11-KO-9) were assayed by immunoblot with the indicated antibodies. (D) sgJFH1-Rluc replicon luciferase assay in parental Huh7 cells and two independent DUSP11 knockout clones (D11-KO-8 and D11-KO-9). Luciferase assays were performed at the indicated times post replicon RNA transfection. The mean ± SEM of three individual experiments is presented. (E) HCV cell culture (HCVcc) infectious virus production [multiplicity of infection (MOI) = 1] in Huh7 and D11-KO-9 cells. Data presented are the mean of three replicates ± SEM. (F) HCVcc RNA replication time course (MOI = 1) in Huh7 and D11-KO-9 cells. Data presented are the mean of three replicates ± SEM. (G) HCVcc infectious virus production (MOI = 10) in HepG2-CD81, HepG2-CD81-D11, CD81-miR-122, and HepG2-CD81-miR-122-D11. Data presented are the mean of three replicates ± SEM. (G, Lower) Immunoblot of lysates from the corresponding cell lines with the indicated antibodies. (H) GS4.1 replicon colony formation assays in parental Huh7 cells and DUSP11 knockout cells (D11-KO-9). Quantitation of both relative area colonized and relative colony counts with transfection of GS4.1 RNA is presented (Left). The mean ± SEM of five individual experiments is presented. Example wells with stained colonies from the indicated cell lines transfected with the indicated RNA are displayed (Right). Statistical significance was assessed by Student’s t test and is indicated as follows: *P < 0.05, **P < 0.01, ***P < 0.001.

