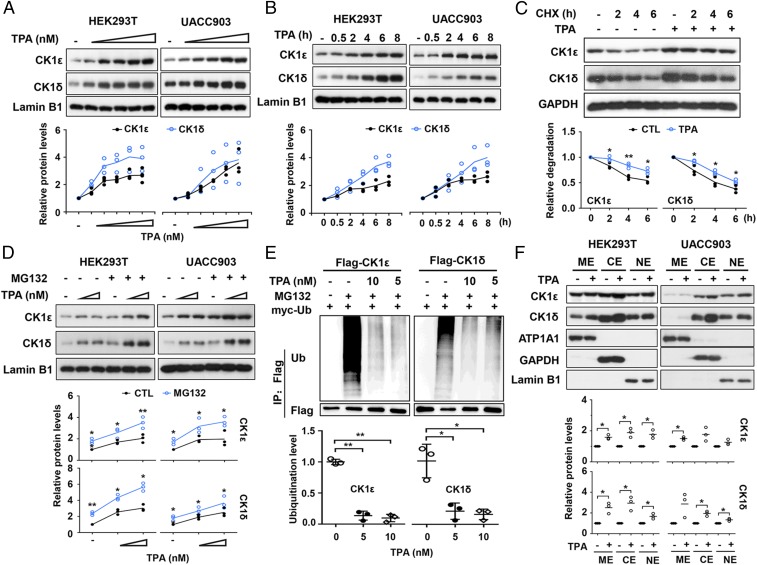
Fig. 3.
TPA regulates the expression and subcellular localization of CK1ε and CK1δ. (A) HEK293T and UACC903 cells were incubated with TPA at increasing concentrations (0, 2, 10, 50, 100, and 200 nM). The whole-cell extracts were analyzed by immunoblotting using the indicated antibodies. The protein levels of CK1ε and CK1δ were quantitated by densitometry and normalized to Lamin B1. Quantitated results are displayed (Bottom). (B) HEK293T and UACC903 cells were incubated with 10 nM TPA for the indicated time period. The expression of CK1ε and CK1δ proteins were assessed by immunoblotting. The protein levels of CK1ε and CK1δ were quantitated by densitometry and normalized to Lamin B1. Quantitated results are displayed (Bottom). (C) HEK293T cells were pretreated with 10 nM TPA for 2 h before 100 μg/mL CHX was added. The cells were harvested after CHX treatment for the indicated times (0, 2, 4, and 6 h) followed by immunoblotting. The protein levels of CK1ε and CK1δ were quantitated by densitometry and normalized to GAPDH. Quantitated results were plotted against indicated time periods to dynamic changes and are displayed (Bottom). *P < 0.05, **P < 0.01 versus vehicle control (Student’s t test, n = 3). (D) HEK293T and UACC903 cells were incubated with increasing concentrations of TPA (0, 100, and 200 nM) for 6 h and then were treated with 10 μM MG132 for 1 h. The cells were harvested and the levels of CK1ε and CK1δ proteins were detected by immunoblotting. The protein levels of CK1ε and CK1δ were quantitated by densitometry and normalized to Lamin B1. Quantitated results are displayed (Bottom). (E) HEK293T cells cotransfected with Flag-CK1ε/δ and myc-ubiquitin (Ub) expression vectors were incubated with or without the indicated concentrations of TPA for 18 h before treatment with 10 μM MG132 for 6 h. Cell lysates were subjected to immunoprecipitation using anti-Flag M2 Sepharose (Sigma) followed by Western blot using specific antibodies as indicated. Ubiquitination of CK1ε and CK1δ protein was quantitated by densitometry from three independent experiments and normalized to Flag levels. Quantitated results were plotted against indicated concentrations of TPA to ubiquitination levels. *P < 0.05, **P < 0.01 versus the corresponding vehicle control (Student’s t test, n = 3). (F) HEK293T cells and UACC903 cells were treated with 10 nM TPA for 6 h, and subcellular fractions were isolated from the whole-cell extracts by Subcellular Protein Fractionation Kit according to the manufacturer’s protocol (Thermo). The protein levels were detected by immunoblotting using specific antibodies as indicated. Data shown are representative from three independent experiments. Protein levels were quantified by densitometry and normalized to the corresponding loading control. CE, cytoplasmic extract; ME, membrane extract; NE, nuclear extract. *P < 0.05 versus the corresponding vehicle control (Student’s t test, n = 3).

