Fig. 2.
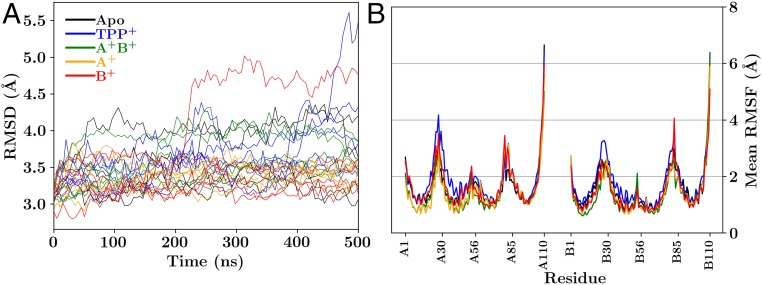
Structural deviation and fluctuation measured over the course of the trajectories. (A) rmsd of each trajectory compared against the 3B5D crystal structure. Due to limitations of the original crystal structure, the comparison strictly involves positions reported in the crystal structure and does not include side chain atoms. The color of the lines indicates the loading state of EmrE: black for the apo state, blue for the -bound state, green for the doubly protonated state (), orange for the state where the proton is bound to monomer A (), and red when the proton is bound to monomer B (). SI Appendix, Fig. S5 is comparable, where the reference state is the first frame of the trajectory, rather than the crystal structure. (B) Mean rmsf per residue, combining the results over all five independent simulations after trajectory alignment for each loading state of EmrE, using the same color scheme as in A. For a detailed trajectory-by-trajectory analysis, see SI Appendix, Fig. S7.

