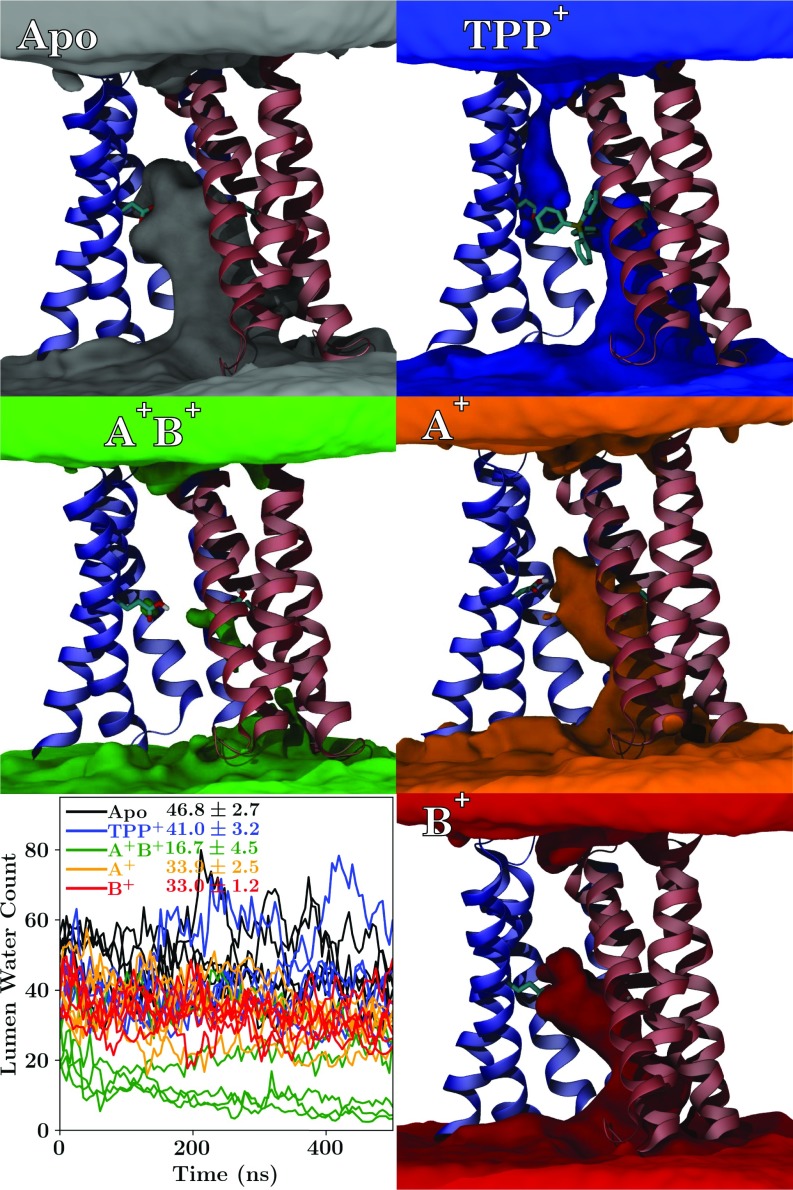
Fig. 4.
Visualization and quantification of the water occupancy across all five replicates within the lumen of EmrE under different loading conditions. Regions where water is frequently present are represented by isosurfaces of different colors (gray for apo, blue for bound, orange for , red for , and green for ), along with a cartoon representation of EmrE for context, including an explicit representation of E14 and where present. Animations of these views during rotation are presented in SI Appendix, Movie S5 A–E. Lower Left shows the number of water molecules within the lumen of EmrE as a function of time for the different loading conditions. All 25 independent trajectories are shown simultaneously and are colored according to the EmrE loading state, with the mean number of luminal waters ( Å) reported beside the key.

