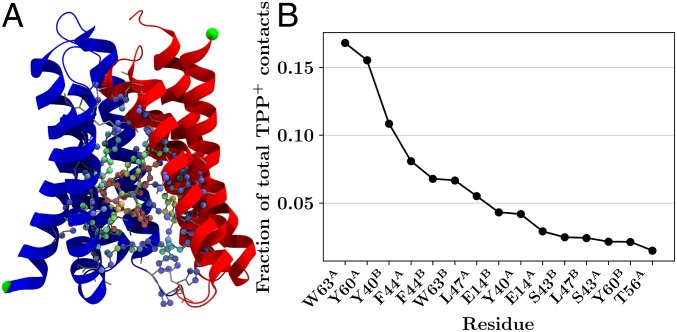
Fig. 7.
contact analysis of elements within EmrE. (A) Pictorial representation of the contact data, where each heavy atom that contacted (and itself) is colored according to the number of contacts. Blue atoms had fewer contacts, and red atoms had more contacts. A cartoon representation of the protein and gray licorice representations of every side chain are also included for context. (B) Ordered listing of the top 15 aa with the most contacts with , expressed as a fraction of the total number of contacts, as computed by SI Appendix, Eq. S1 (46, 47), over all trajectories. Together, the 15 residues listed here account for over 92% of the total contacts with .

