Fig. 5.
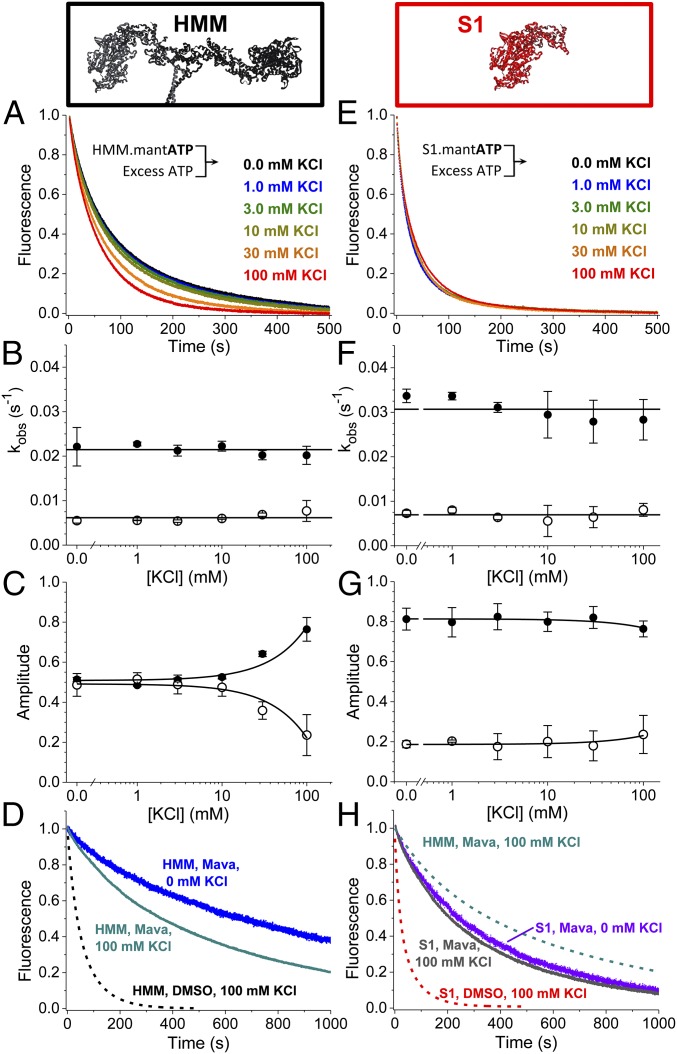
Ionic strength dependence of basal ATP turnover. (A and E) HMM (0.4 µM) (A) or 0.8 µM S1 (E) was mixed with 8.0 µM mant-ATP and then was mixed with 2.0 mM MgATP. Data best fit to two exponentials. (B) The rates of HMM’s basal mant-ATP turnover are relatively constant over these [KCl]; the average values are depicted by the horizontal line. Closed circles represent the fast phase; open circles represent the slow phase. (C) The amplitude of the fast phase increases with increasing [KCl]. Closed circles represent the fast phase; open circles represent the slow phase. Linear fits show trends. (D) In the presence of mava, HMM is sensitive to increasing ionic strength (compare blue and dark cyan traces). (F and G) The rates (F) and amplitudes (G) of S1’s basal mant-ATP turnover are relatively constant. Linear fits show trends. (H) S1 in the presence of mava is insensitive to changes in [KCl] (compare violet and gray traces), consistent with S1 in the absence of mava (E). n = 4 for replicates for each [KCl]. Fits are reported in SI Appendix, Table S1. Error bars indicate SEM.

