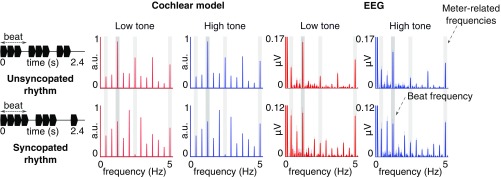
Fig. 1.
Spectra of the acoustic stimuli (processed through the cochlear model) and EEG responses (averaged across all channels and participants; n = 14; shaded regions indicate SEMs; see ref. 30). The waveform of one cycle for each rhythm (2.4-s duration) is depicted in black (Left) with the beat period indicated. The rhythms were continuously repeated to form 60-s sequences, and these sequences were presented eight times per condition. The cochlear model spectrum contains peaks at frequencies related to the beat (1.25 Hz; dark-gray vertical stripes) and meter (1.25 Hz/3, ×2, ×4; light-gray vertical stripes), and also at frequencies unrelated to the beat and meter. The EEG response includes peaks at the frequencies contained in the cochlear model output; however, the difference between the average amplitude of peaks at frequencies related vs. unrelated to the beat and meter is increased in the low-tone compared with high-tone conditions (see Relative Enhancement at Beat and Meter Frequencies and Fig. 2). Note the scaling difference in plots of EEG responses for unsyncopated and syncopated rhythms.

