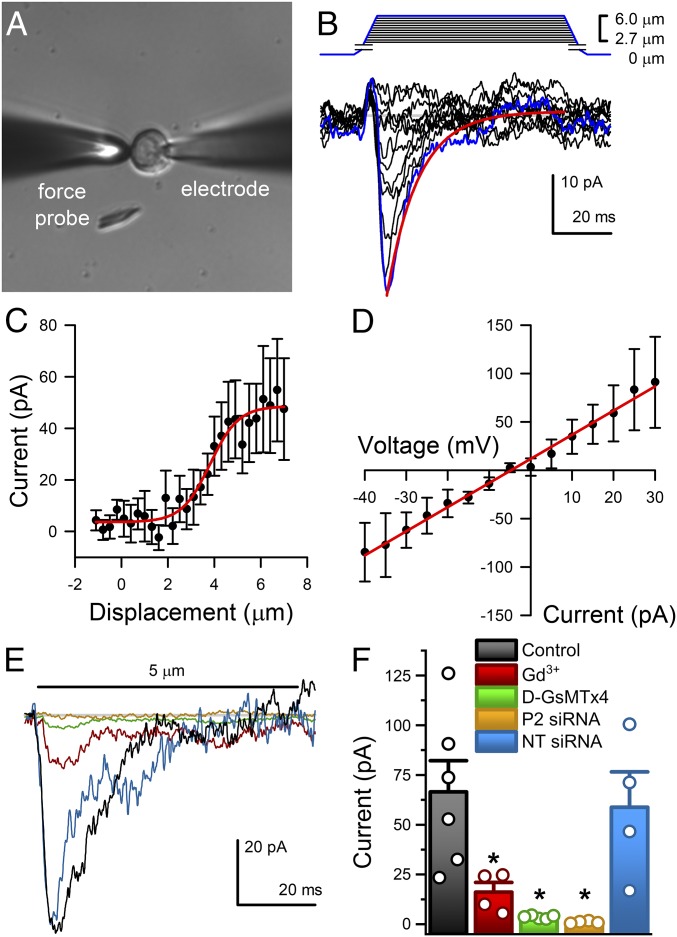
Fig. 3.
Piezo2 carries fast mechanosensitive nonrectifying current in NeuroD1+ cells. (A) Differential interference contrast (DIC) of a primary EC cell voltage-clamped in whole-cell mode (electrode) and mechanically stimulated by a glass probe (force probe). (Magnification: 40×.) (B) Graded increase in cell membrane deformation (0.3 µm per step at −70 mV) results in rapidly activating and inactivating inward currents (peak response, blue trace). (C) Peak current (pA) deformation (µm) relationship fit by a two-state Boltzmann function (red) with midpoint (Z0) 3.46 ± 0.80 µm and slope (dz) 0.79 ± 0.27 (n = 5). (D) Current–voltage relationship of peak currents in response to 5-µm membrane displacement fit by a linear function (red) with slope (dV) 0.61 ± 0.17 pA/mV and x-intercept (V0) −4.26 ± 1.34 mV (n = 5). (E) Typical peak force-induced fast inward currents (black) in EC cells were inhibited by 30 µM Gd3+ (red), 10 µM D-GsMTx4 (green), and Piezo2 siRNA (yellow), but not by NT siRNA (blue). (F) Individual (circles) and mean ± SEM (bars) peak current (pA) in control EC cells (black, 66.5 ± 15.7 pA, n = 6), and significant inhibition of peak current by Gd3+ (red, 16.1 ± 4.9 pA, n = 4, *P < 0.05, ANOVA with Bonferroni correction), D-GsMTx4 (green, 3.6 ± 0.4 pA, n = 5, *P < 0.05, ANOVA with Bonferroni correction), and Piezo2 siRNA (yellow, 1.1 ± 0.8 pA, n = 4, *P < 0.05 compared with NT siRNA, ANOVA), but not NT siRNA (blue, 58.8 ± 17.8 pA, n = 4, P > 0.05 compared with controls, ANOVA with Bonferroni correction).

