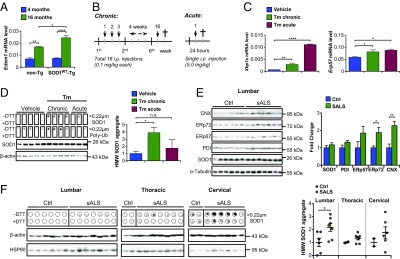
Fig. 2.

Disulfide–cross-linked SOD1WT aggregates in transgenic mice under ER stress and in sALS patients. (A) mRNA levels of the ER stress marker Edem1 were analyzed by quantitative PCR in the spinal cord of SOD1WT-Tg mice and non-Tg littermates at different ages (n = 3 to 6 per group). (B) Schematic view of the protocol for induction of chronic and acute ER stress in vivo. In the chronic paradigm, mice were treated with a total of 16 low doses of tunicamycin (Tm). In the acute protocol, mice received a single high-dose injection of Tm. (C) mRNA levels of the ER stress markers Xbp1s and Erp57 were analyzed by quantitative PCR in the spinal cord of SOD1WT-Tg mice submitted to Tm treatments. (D) Filter-trap assay of total spinal cord extracts of hSOD1WT-Tg mice described in C under nonreducing (−DTT) and reducing (+DTT) conditions for detection of HMW SOD1 and polyubiquitinated aggregates. Duplicated membranes were employed in this analysis. β-Actin was employed as loading control. Statistical analysis was performed using two-way ANOVA (A) or one-way ANOVA (C and D) with Tukey’s multiple comparison test. Mean ± SE is shown; P values are as follows: n.s., P > 0.05; *P ≤ 0.05; **P ≤ 0.01; ****P ≤ 0.0001. n = 3 to 6 per group. Frozen postmortem spinal cord tissue of sALS patients and controls (SI Appendix, Table S1) was processed for biochemical analysis. (E) Western blot analysis of SOD1 and ER chaperone levels in lumbar spinal cord of sALS cases and controls. α-Tubulin was employed as loading control. CNX, calnexin. (F) Filter-trap assay of total spinal cord extracts of sALS cases and controls under nonreducing (−DTT) and reducing (+DTT) conditions for detection of HMW SOD1 aggregates. β-Actin was employed as loading control. (Left) Lumbar, (Middle) thoracic, and (Right) cervical spinal cord segments. Statistical analysis was performed using Student’s t test. Mean ± SE is shown; P values are as follows: n.s., P > 0.05; *P ≤ 0.05; **P ≤ 0.01. n = 6 or 7 per group.
