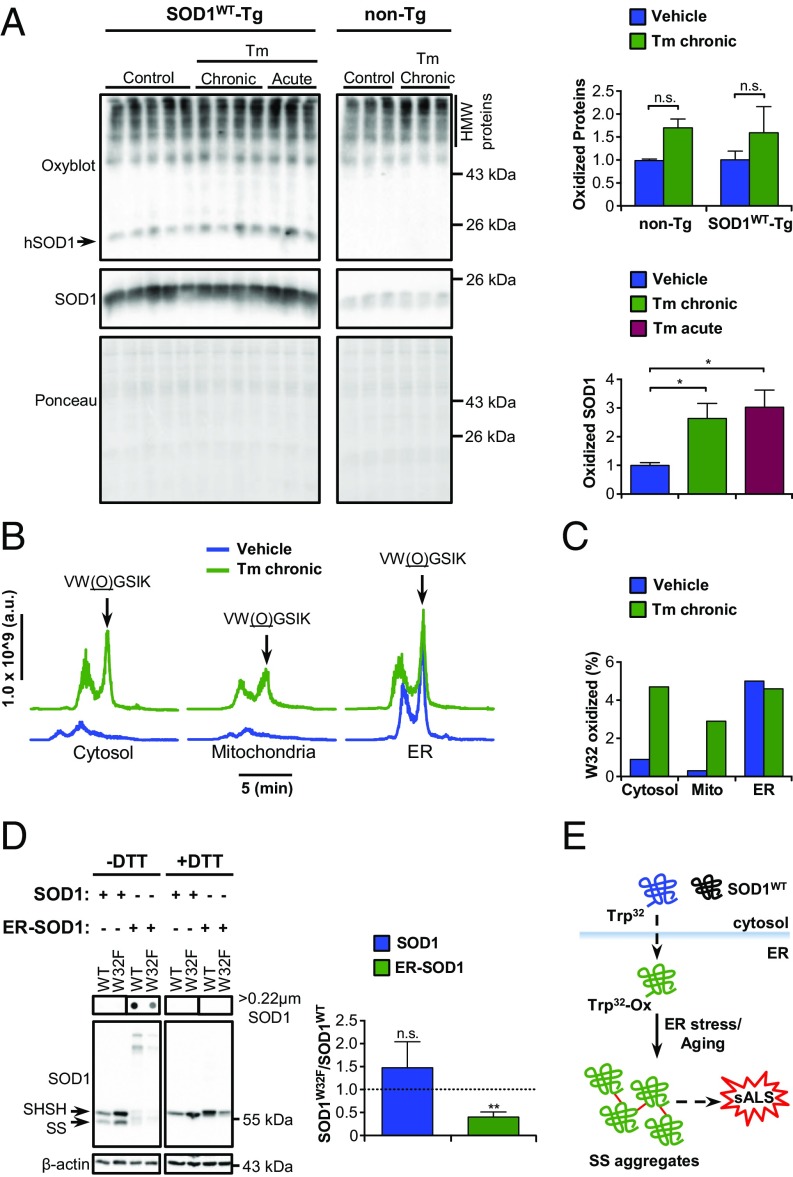
Fig. 4.
Posttranslational modification and aggregation of SOD1WT in the ER. (A) Western blot analysis of carbonylated (oxidized) proteins in total extracts of SOD1WT-Tg mice and non-Tg littermates submitted to tunicamycin treatments as indicated. The arrow points to oxidized SOD1WT. Ponceau S staining was employed as loading control. Statistical analysis was performed using two-way ANOVA (Upper) or one-way ANOVA (Lower) with Tukey’s multiple comparison test. Mean ± SE is shown; P values are as follows: n.s., P > 0.05; *P ≤ 0.05. n = 3 to 5 per group. (B and C) Mass spectrometry analysis of posttranslational modifications of SOD1WT isolated from spinal cord subcellular fractions of SOD1WT-Tg mice submitted to chronic Tm treatment. Seven animals were pooled in each sample. (B) Liquid chromatograms of a double-charged precursor ion with m/z = 353.20. Arrows indicate the peptide with oxidized tryptophan 32 [VW(O)GSIK]. Chromatograms were aligned to facilitate visualization. (C) Quantification of the percentage of SOD1 containing oxidized W32. (D) NSC-34 cells were transiently transfected for overexpression of SOD1WT-EGFP, SOD1W32F-EGFP, ER-SOD1WT-EGFP, or ER-SOD1W32F-EGFP. Filter-trap and Western blot analyses under nonreducing (−DTT) and reducing (+DTT) conditions were performed 48 h after transfection. Arrows indicate reduced (SHSH) or oxidized (SS) SOD1WT monomer. The graph shows the ratio of SOD1W32F to SOD1WT total protein levels. Statistical analysis was performed using Student’s t test. Mean ± SE is shown; P values are as follows: n.s., P > 0.05; **P ≤ 0.01. n = 3. (E) Schematic model for SOD1WT aggregation in the ER. Dashed arrows indicate unidentified pathways.

