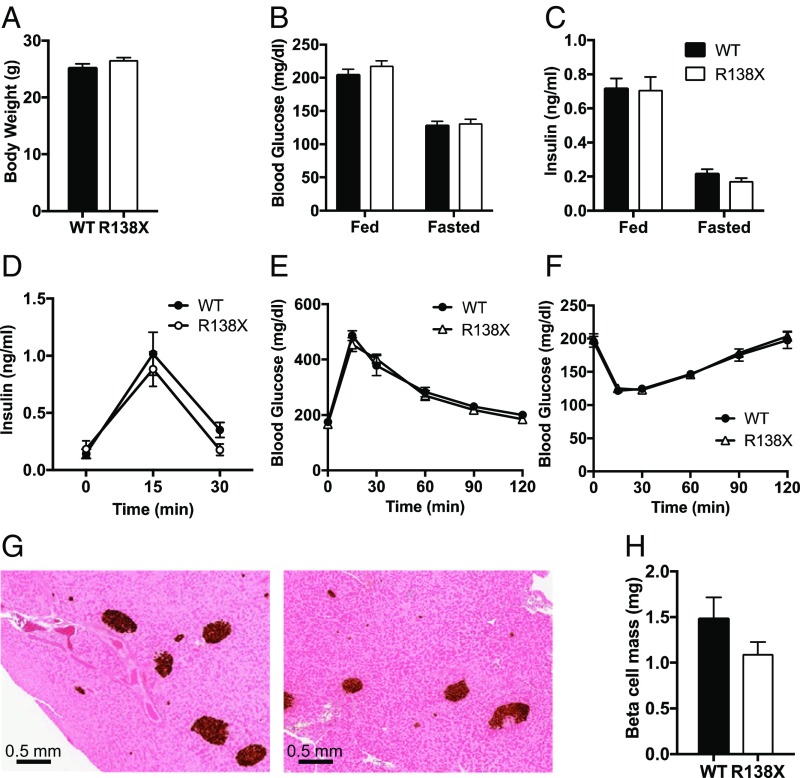
Fig. 2.
Metabolic phenotype of male R138X mice on chow diet. (A–C) Body weight (A), blood glucose (B), and plasma insulin (C) in fed and fasted WT and R138X mice (n = 18 to 20 per genotype). (D) Plasma insulin levels in WT or R138X mice after an overnight fast (time 0) and at the indicated times after an i.p. injection of glucose. Data are displayed as blood insulin levels over time (n = 6 per genotype). (E) Oral glucose tolerance test in overnight-fasted (time 0) WT and R138X mice. Data are displayed as blood glucose over time (n = 6 per genotype). (F) Insulin tolerance test in 4-h-fasted WT and R138X mice. Data are displayed as blood glucose levels over time (n = 6 per genotype). (G) Histology for insulin in pancreas isolated from WT and R138X mice. (H) Quantification of pancreatic insulin staining (n = 6 per genotype). Values represent the means ± SEM. Data were analyzed by two-way ANOVA or Student’s t test. No significance was reached.

