. 2017 Feb 28;8(5):3641–3649. doi: 10.1039/c7sc00497d

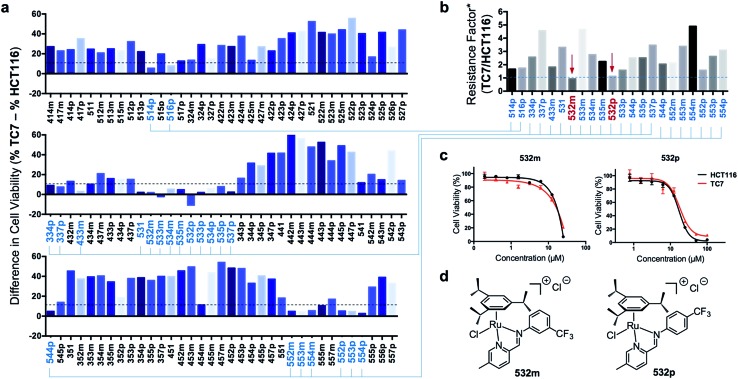
Fig. 6. Screening and identification of two apoptosis-independent ‘hits’. (a) Summary of the difference in cell viabilities (%) between apoptosis-resistant TC7 and apoptosis-sensitive HCT116 treated with the corresponding RAS complexes (25 μM). A smaller difference indicated a greater ability to overcome apoptosis-resistance. 22 complexes (highlighted in blue) were selected for a secondary screening. (b) Summary of the resistance factors# (RF) of the 22 RAS complexes. A lower RF indicated a greater ability to overcome apoptosis resistance. (c) Cell viability curves of TC7 and HCT116 cells treated with various concentration of ‘hit’ compounds 532m and 532p. (d) Structures of the 2 ’hit’ compounds identified. #RF was calculated by taking the ratio of the eIC50 in TC7 and HCT116. The eIC50 was calculated based on the cell viability curves obtained from one experiment and three replicates for each concentration of drug treatment.

Fig. 6