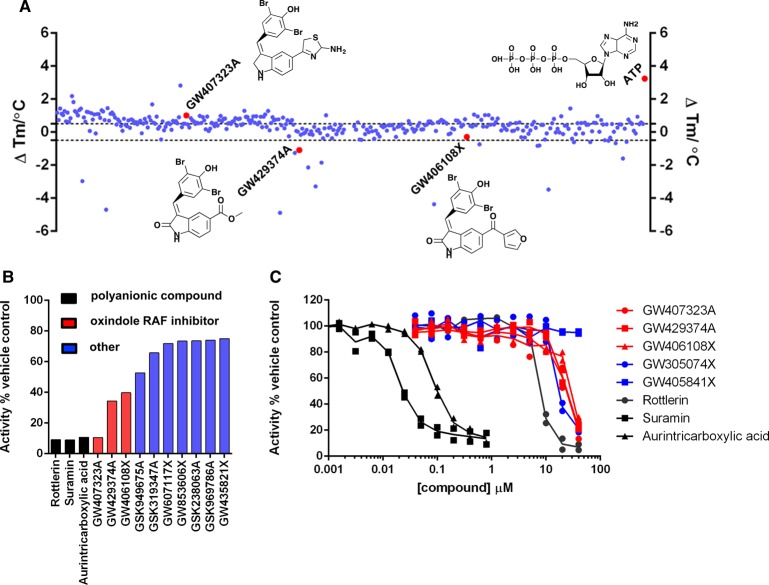
Figure 4. Mining the PKIS inhibitor library for HS2ST inhibitor compounds.
(A) Evaluation of small-molecule ligands in a high-throughput HS2ST DSF assay. HS2ST (5 μM) was screened in the presence or absence of 40 μM compound. The final concentration of DMSO in the assay was 4% (v/v). ΔTm values (positive and negative) were calculated by subtracting the control Tm value (DMSO alone) from the measured Tm value. Data shown on a scatter plot of the mean ΔTm values from two independent DSF assays. (B) Enzymatic analysis of HS2ST inhibition by selected PKIS compounds. HS2ST (20 nM) was incubated with the indicated PKIS compound (40 μM) in the presence of 10 μM PAPS for 15 min at room temperature. HS2ST sulfotransferase activity was assayed using the fluorescent hexasaccharide substrate and normalised to DMSO control (4%, v/v). (C) Full dose–response curves for selected compounds. HS2ST (20 nM) was incubated with increasing concentration of inhibitor in the presence of 1 μM PAPS for 15 min at 20°C. HS2ST activity calculated as above. Data from two independent experiments are combined. Similar results were seen in an independent experiment.

