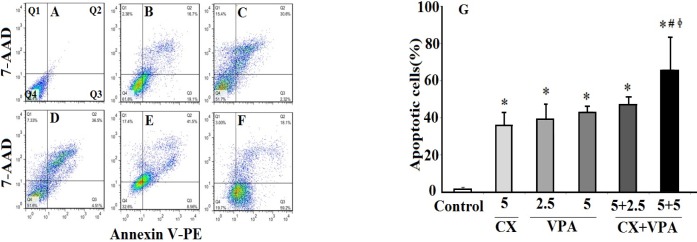
Figure 2.
The effects of VPA and CX on apoptosis of B-CPAP cells. Represented flowcytometric charts (A-F) show the percentage of live (Q4), early apoptotic (Q3), late apoptotic (Q2), and necrotic cells (Q1) in different group (A: control group, B: 5 µM of CX, C: 2.5 mM of VPA, D: 5 mM of VPA , E: 5 µM of CX + 2.5 mM of VPA, F: 5 µM of CX + 5 mM of VPA). Histogram (G) compares the percentage of total apoptotic cells (Q2+Q3) in CX, VPA, and CX+VPA -treated and control B-CPAP cells. The represented data are mean ± SD of at least three independent experiments. Data were analyzed using one-way ANOVA followed by Tukey’s post-hoc test. *P < 0.05 compared to control group; #P < 0.05 compared to CX (5 µM) group, ɸP < 0.05 compared to VPA (2.5 and 5 mM)-treated groups.

