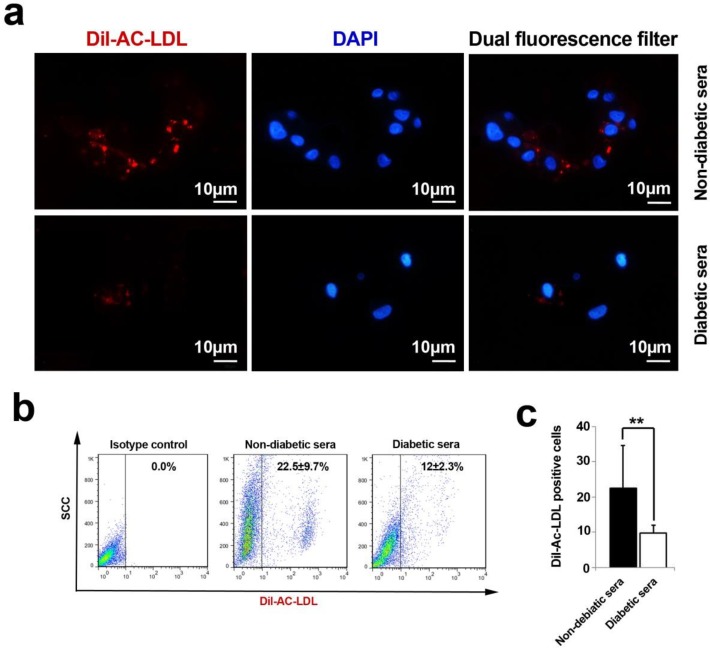
Figure 4.
An analysis of Ac-LDL uptake capacity by immunofluorescence and flow cytometry techniques (A-C). The cells lost their ability to uptake Ac-LDL under diabetic condition. Both immunofluorescence imaging (A) and flow cytometric analysis (B) confirmed a vivid decline in the percent of fluorescent tag cells (C). Data were presented as means ± SD. Statistical analysis was performed using student's t-test. * p < 0.05, **p < 0.01, ***p < 0.001.

