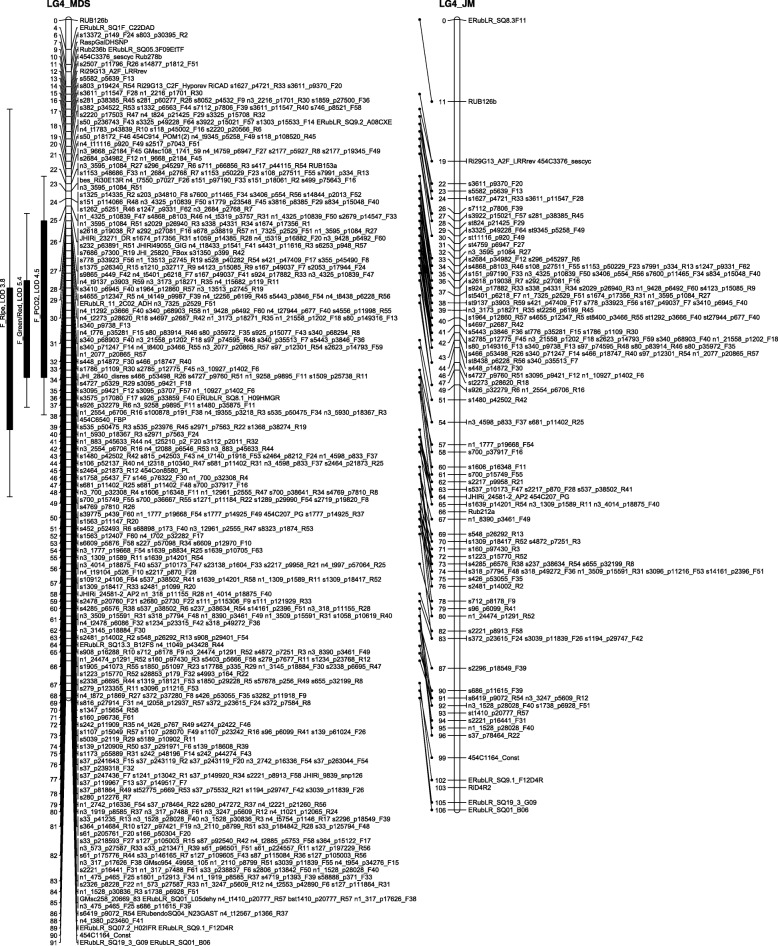
Fig. 4.
GbS linkage map of linkage group 4 of Glen Moy × Latham. Maps are ordered by MDS or by two rounds of JoinMap (JM). Black bars and whiskers (to the left of the chromosome) show one- and two-lod support intervals for QTL locations for developmental traits in 2006. F before a trait name indicates the field trial, P indicates the protected trial

