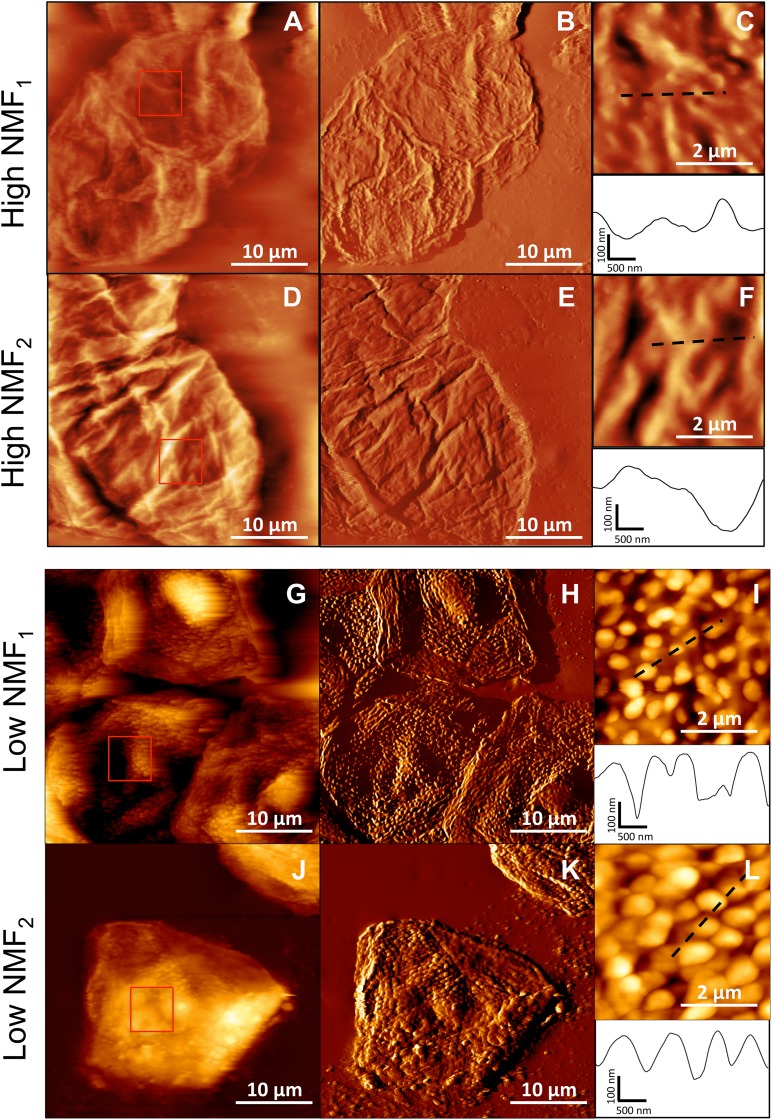
FIG 2 .
Topographic imaging reveals major structural differences between corneocytes with high and low NFM levels. Height images (z-range = 2 µm) (A, D, G, and J) and corresponding deflection images (B, E, H, and K) recorded in PBS for corneocytes from patients with high NMF levels (high NMF1 and high NMF2) or low NMF levels (low NMF1 and low NMF2). (C, F, I, and L) High-resolution height images recorded in the square areas shown in panels A, D, G, and J, together with vertical cross sections taken along the dashed lines.

