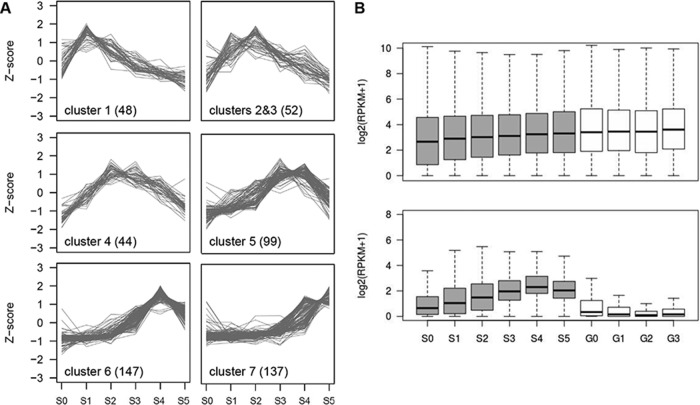
FIG 3 .
Sexual stage-induced lncRNA in F. graminearum. (A) Coexpressed clusters of lncRNAs. Trend plots of Z-score normalized expression values for lncRNAs (numbers in parentheses) in a given cluster are presented. (B) Expression distribution of mRNA (upper panel) and lncRNA (lower panel) for the sexual development transcriptome (gray boxes) and the vegetative growth transcriptome (white boxes). Box and whisker plots indicate the median, interquartile range between the 25th and 75th percentiles (box), and 1.5 interquartile range (whisker).

