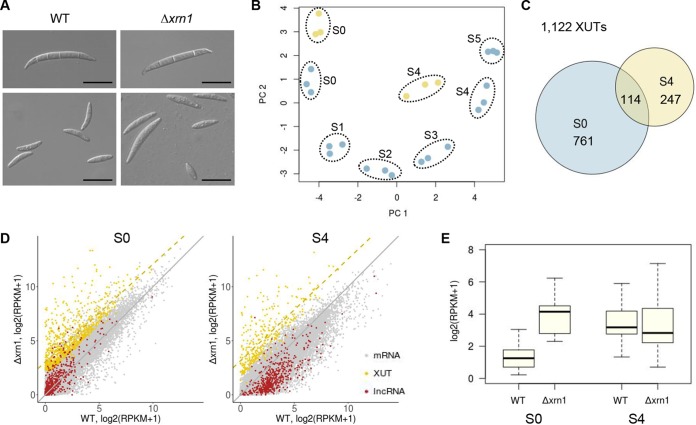
FIG 7 .
Identification of lncRNAs regulated by the NMD pathway. (A) Asexual spore (macroconidia) morphology (upper panels) and sexual spore (ascospore) morphology (lower panels). Note the size variation of ascospores in the Δxrn1 mutant. Scale bars = 20 µm. (B) Principal-component analysis of the perithecial transcriptome data from the wild type (S0 to S5 [blue circles]) and Δxrn1 transcriptome data (S0 and S4 [yellow circles]). (C) Venn diagram showing the overlap of Xrn1-sensitive unstable transcripts (XUTs) at S0 and S4 (D) Two-dimensional plots of different classes of transcripts between the wild-type (abscissa) and Δxrn1 mutant (ordinate) expression data at S0 and S4 (diagonal [gray line]). The yellow dashed line shows regression for the XUTs. (E) Expression distribution of 25 lncRNAs that were identified as XUTs at S0 and S4. Box and whisker plots indicate the median, interquartile range between the 25th and 75th percentiles (box), and 1.5 interquartile range (whisker).

