Fig. 4.

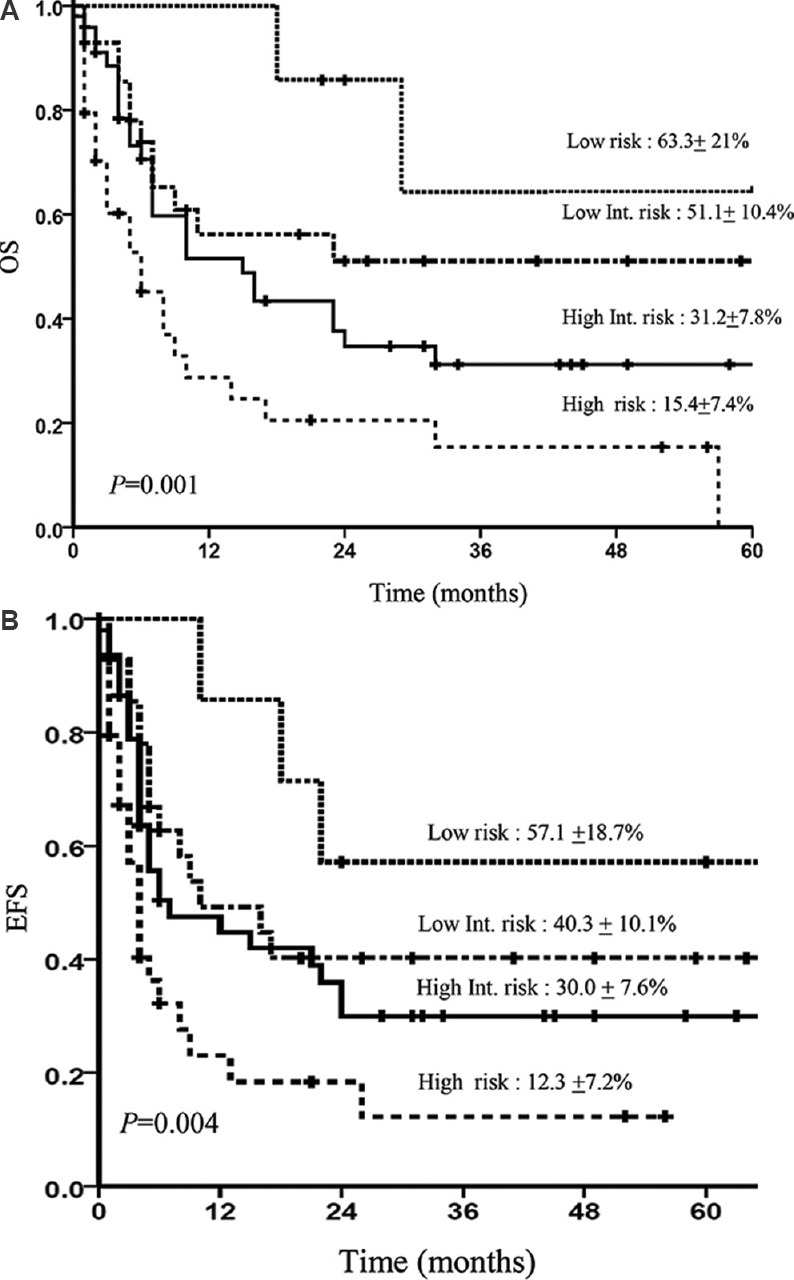
Kaplan-Meier curve showing overall survival (OA) (A) and event-free survival (EFS) (B) according to the prognostic index for T cell lymphoma (PIT) in all treated patients.

Kaplan-Meier curve showing overall survival (OA) (A) and event-free survival (EFS) (B) according to the prognostic index for T cell lymphoma (PIT) in all treated patients.