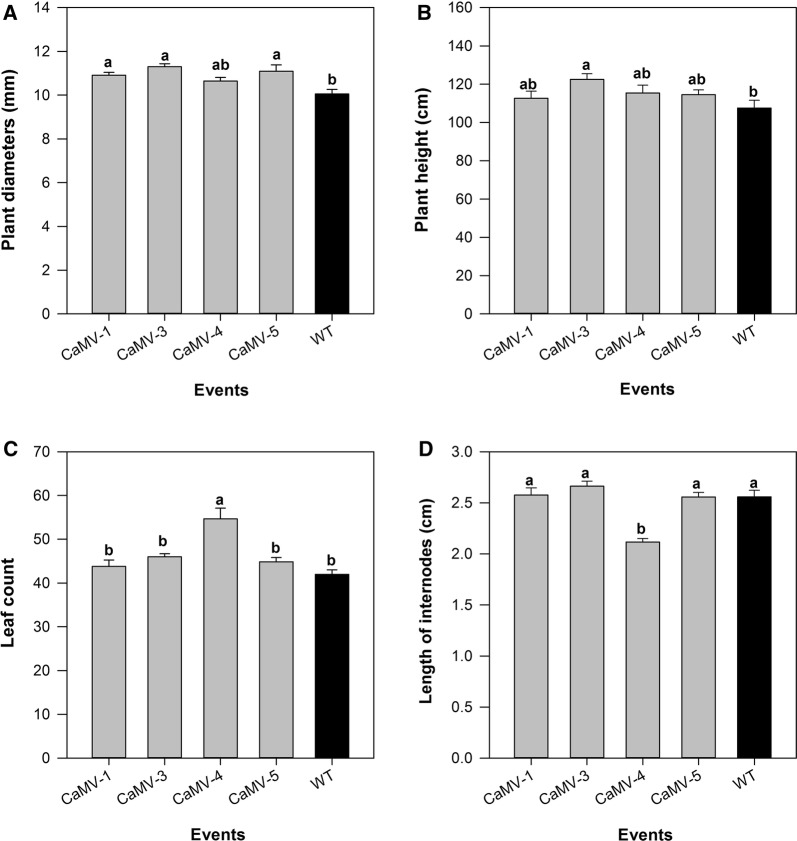
Fig. 2.
Growth comparison of 4-month-old greenhouse-grown transgenic TnCelB-overexpressing poplar and WT control. A Stem diameter; B plant height; C leaf number; and D length of internode. Each bar represents mean of five individual plants. Different letters represent significant differences among the samples (p ≤ 0.05) as calculated by one-way ANOVA followed by Tukey post hoc analysis

