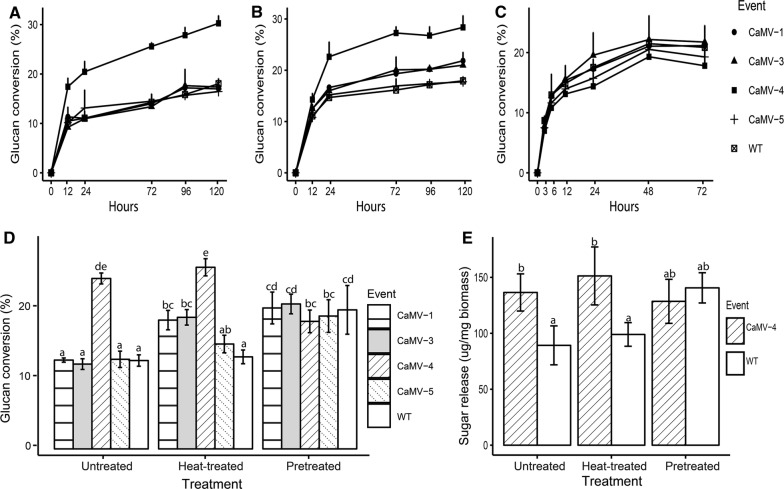
Fig. 4.
Enzymatic saccharification efficiency of transgenic events and WT. Glucan conversion rates of untreated biomass (A), heat-treated biomass (B), and heat-treated biomass followed by a mild acid pretreatment (C). Liquid hydrolysate was collected at different timepoints over 72–120 h, and glucose measured by ion-exchange chromatography. D Comparison of glucan conversion rates at 72 h of untreated biomass, heat-treated biomass, and pretreated biomass of transgenic events and WT. E Comparison of released glucose concentration of CaMV-4 and WT among three treatments. Each bar represents mean of three individual plants per event with the standard error. Different letters represent significant differences among the samples (p ≤ 0.05) as calculated by one-way ANOVA followed by Tukey post hoc analysis

