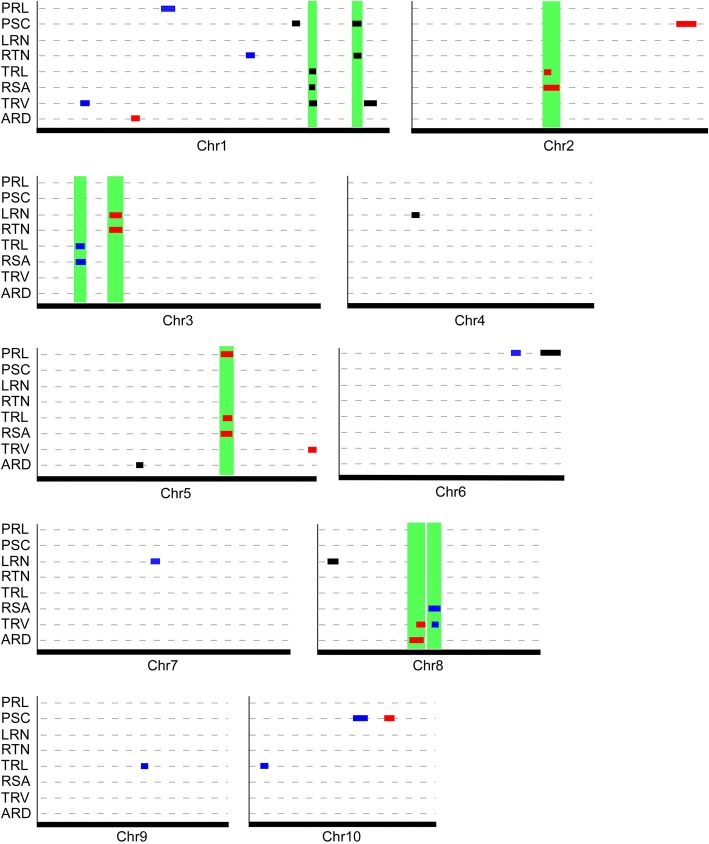
Fig. 2.
QTL plots for eight seedling root traits across three time-points after germination identified in the Zong3 × Yu87–1 RIL population. In each small plot, the x-axis represents the indicated maize chromosome, with the length proportional to that of the genetic linkage map, and the y-axis lists the eight seedling root traits analyzed. QTLs are shown as colored boxes on the relative positions of the chromosomes, with QTLs detected at 4 dag (black), 9 dag (blue), and 14 dag (red). The green rectangles show the chromosomal regions in which the different QTLs co-localized

