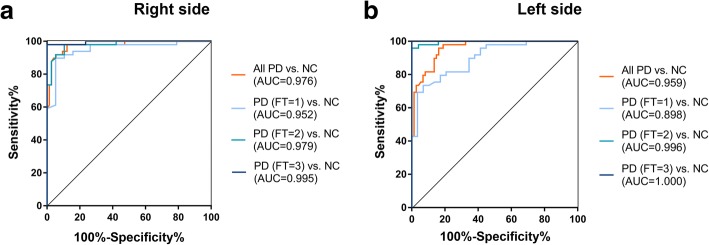
Fig. 3.
PD-Monitor FT objective score detected different severity of bradykinesia. The ROC curves illustrated strong separation between overall PD and NC, as well as between each subgroup (FT = 1, FT = 2, FT = 3) of PD and NC. a Right affected side, All PD vs. NC: AUC = 0.976, accuracy = 93.5%, sensitivity = 94.6%, specificity = 91.8%, cutoff = 0.018; PD (FT = 1) vs. NC: AUC = 0.952, accuracy = 89.7%, sensitivity = 94.7%, specificity = 89.8%, cutoff = 0.005; PD (FT = 2) vs. NC: AUC = 0.979, accuracy = 94.3%, sensitivity = 89.5%, specificity = 98.0%, cutoff = 0.118; PD (FT = 3) vs. NC: AUC = 0.995, accuracy = 98.5%, sensitivity = 100%, specificity = 98.0%, cutoff = 0.122; all with P = 0.000. b Left affected side: All PD vs. NC: AUC = 0.959, accuracy = 88.6%, sensitivity = 85.1%, specificity = 91.8%, cutoff = 0.072; PD (FT = 1) vs. NC: AUC = 0.898, accuracy = 81.0%, sensitivity = 65.5%, specificity = 89.8%, cutoff = 0.060; PD (FT = 2) vs. NC: AUC = 0.996, accuracy = 97.3%, sensitivity = 96.0%, specificity = 98.0%, cutoff = 0.122; PD (FT = 3) vs. NC: AUC = 1.000, accuracy = 100%, sensitivity = 100%, specificity = 100%, cutoff = 0.308; all with P = 0.000. PD, Parkinson’s disease; NC, normal controls; FT, finger tapping; ROC, Receiver operating characteristics; AUC, area under the ROC curve

