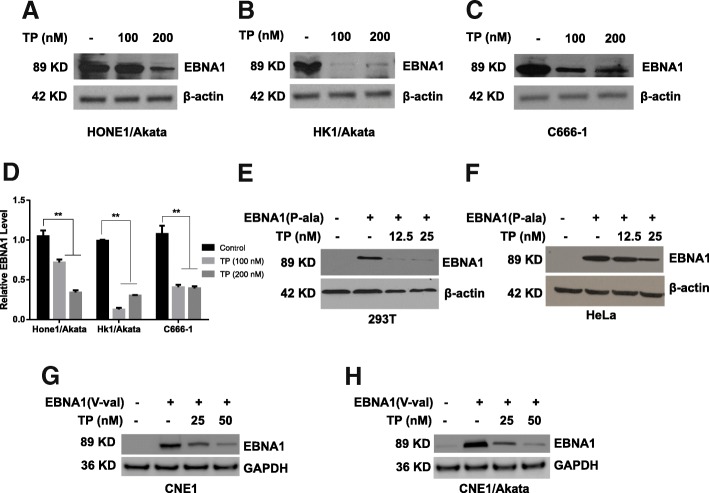
Fig. 3.
TP decreases the expression of EBNA1. a HONE1/Akata, b HK1/Akata, and (c) C666–1 cells were treated with DMSO (0.01%) or TP (100 or 200 nM) for 48 h, respectively. Fig. d showed the quantified bar graph of EBNA1 expression in NPC cell lines treated with TP. e 293 T or (f) HeLa cells were transfected with pSG5 or pSG5-EBNA1(P-ala) for 4 h, followed by treatment with TP (12.5 or 25 nM) for 44 h. g CNE1 and (h) CNE1/Akata were transfected with pGEM or pGEM-EBNA1(V-val) for 4 h, followed by 44 h treatment with TP (25 or 50 nM). Whole-cell extracts were prepared and subjected to Western blot analysis

