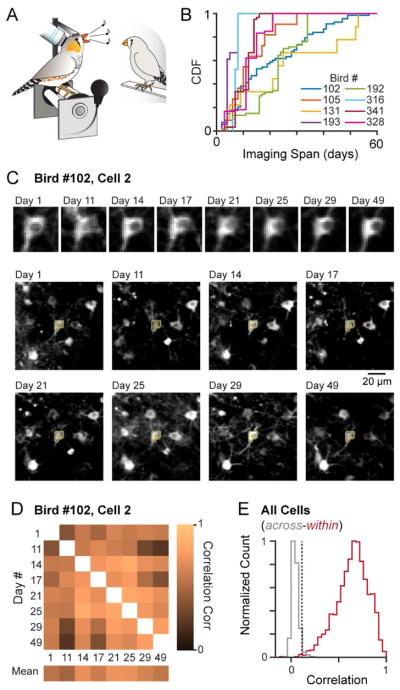
Figure 1. Longitudinal Imaging of HVC Song-related Network Activity.
(A) Birds were trained in a head-fixed configuration, enabling two-photon microscopy during directed singing.
(B) Cumulative distributions for recording durations, defined as the elapsed time between the first and last imaging sessions for each neuron.
(C) Anatomical characterization of a representative neuron. For each cell in the study, the cell body (top) and the local region surrounding each neuron (bottom) were analyzed. Each image is an average across all song trials for a specific day. Yellow outline indicates the ROI.
(D) Spatial cross-correlations between local regions of an ROI on different days.
(E) Distributions of mean spatial scores within an ROI (red) compared with those across ROIs (grey). Cell-days with spatial scores below the upper 98% confidence interval of the null distribution (dashed line, r = 0.11) were removed.

