
Figure 3. Optogenetic Stimulation of Kiss1ARH Axons in the Rostral POA Promotes a Heat-Dissipation Response in Female Mice.
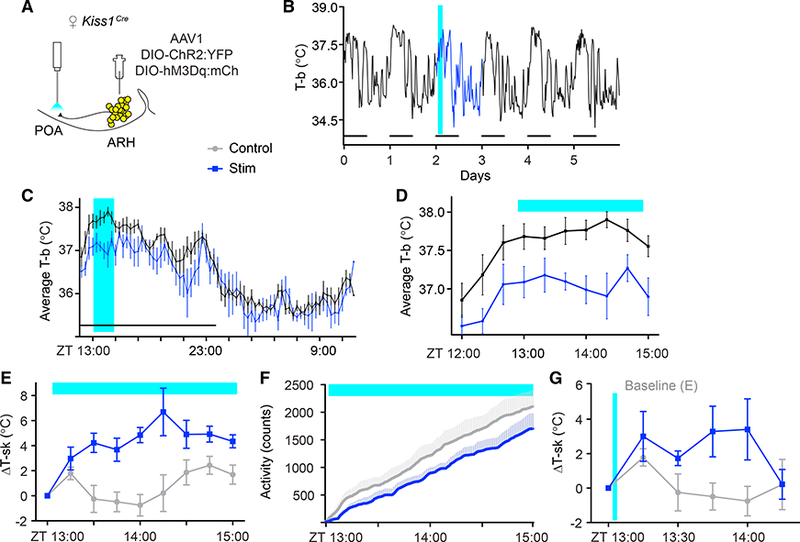
(A) Schematic representation of the targeted viral injection into the ARH and fiber-optic placement 0.5 mm above the POA.
(B-D) Optogenetic stimulation (2 Hz) of Kiss1ARH neuron fibers in the POA was sufficient to transiently decrease T-b. Within-subject comparison of unstimulated baseline (black trace) vs. stimulated (blue trace).
(B) 6-day T-b recording of a single mouse, subjected to blue-light stimulation from ZT = 13:00–15:00 on day 2 (blue).
(C) Average T-b comparing baseline versus stimulation on a scale of 24 hr.
(D) Average T-b comparing baseline vs. stimulation on a scale of 2 hr; n = 5; F(1,72) = 9.589, p = 0.0147.
(E) T-sk in control versus terminal-stimulated females; n = 5; F(1,64) = 17.83, p = 0.0029.
(F) Telemetry recording of locomotor activity, n = 5, F(1,960) (activity) = 185.8, p < 0.00001.
(G) T-sk following a brief (2-min, 2 Hz) stimulation; n = 5; F(1,48) = 9.41, p = 0.0035.
F statistics represent the main effect of treatment by two-way RM-ANOVA. Error bars represent ± SEM. Crossover design with randomized starts.