
Figure 4. Evoked Hot Flushes Are Sensitive to Ovarian Estrogens and Are Blocked by Neurokinin Receptor Antagonists Delivered to the POA.
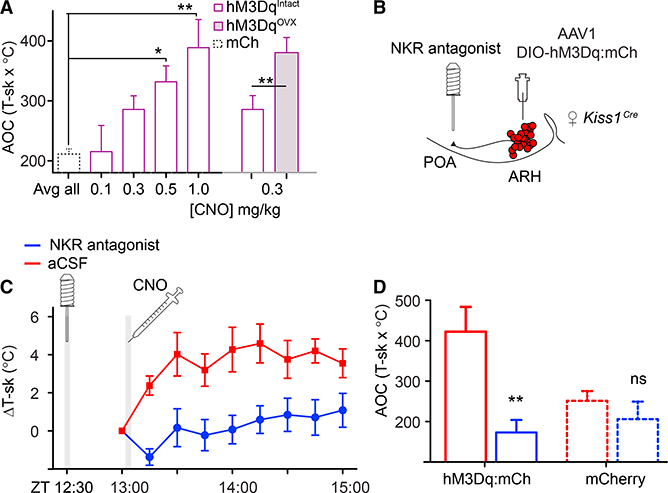
(A) Dose response of T-sk to CNO. CNO was injected at ZT = 13:00, and T-sk was monitored for 2 hr; data are presented as the average area under the curve (AOC; hours x °C). mCherry-expressing controls were treated with CNO (0.05 to 1 mg/kg) and averaged. One-way ANOVA: for mCh, n = 8; for hM3Dq, n = 6; **p = 0.0006, asterisks indicate Bonferroni post-test results. Following ovariectomy, females were significantly more sensitive to 0.3 mg/kg CNO. Paired t test, n = 6. Intact: M = 285.6, SD = 22.74; ovari- ectomized, M = 393.1, SD = 29.31. t(5) = 2.605; *p = 0.0480.
(B) Schematic representation of targeted viral injection into the ARH and placement of infusion cannula in the POA.
(C) Infusion of the cocktail of antagonists was sufficient to block CNO-induced flushing. 30 min prior to recording, either saline or antagonists were infused into the POA of h M3Dq-expressi ng females. T-sk was recorded every 15 min starting immediately prior to CNO delivery at ZT = 13:00. Two-way RM-ANOVA, n = 6; F(1, 45) = 84.05, p < 0.00001.
(D) T-sk from ZT = 13:00–15:00 represented as AOC. hM3Dq data were extracted from (B) and compared to mCherry-expressing controls that were treated in the same manner. Two-way RM-ANOVA main effect of antagonists, n = 6 or 8 per group (hM3Dq or mCh); F(1, 12) = 16.49, **p = 0.0016; Bonferroni post-tests compare artificial cerebral spinal fluid (ACSF) with antagonists for paired animals in each group. ns, not significant.
Experiments were conducted using a crossover design with randomized start times. All error bars represent SEM.