
FIGURE 7.
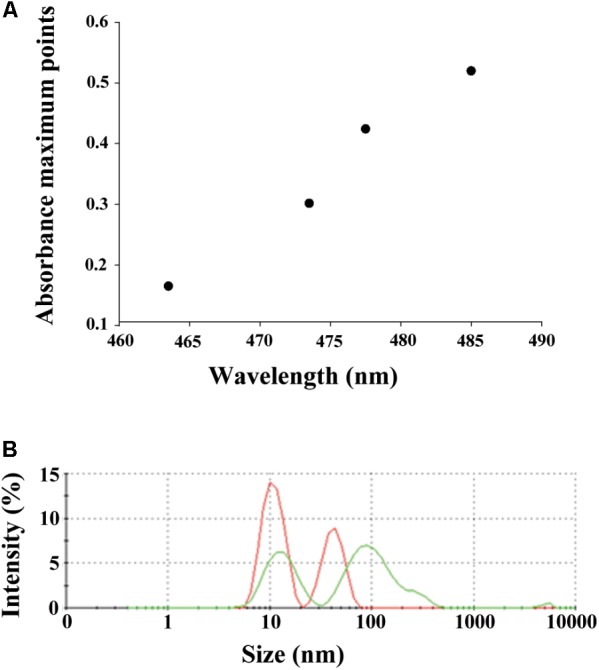
Results of analyses of the interactions of AgNPs and naphthoquinones. (A) The changes of the maximum absorbance points of spectra of the 3ChPL (initial concentration 20 μg/mL) titrated with AgNPs (concentration range 1.8–7.4 μg/mL). (B) Changes in hydrodynamic diameter size of nanoparticles measured by DLS in the presence of 3ChPL. Red line corresponds to average hydrodynamic diameter size distribution in a polydispersive population of AgNPs (initial concentration 12.3 μg/mL), peaks size: 10.96 and 42.63 nm. Green line represents the average hydrodynamic diameter size distribution of mixture containing AgNPs and 3ChPL (final concentrations 12.2 and 8 μg/mL, respectively), peaks size: 13.61 and 119.9 nm.