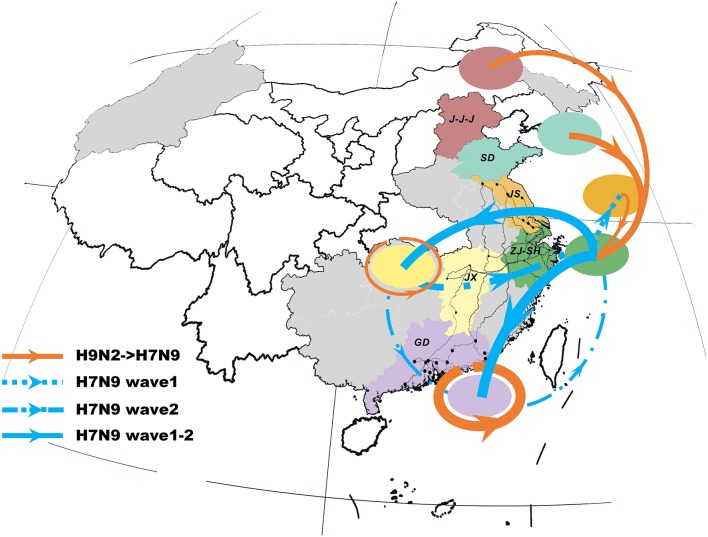
Figure 2.
Viral propagation network for internal gene segments of H9N2-H7N9 viruses. Viral migration routes are distinguished by subtype, epidemic wave, and strength. Specifically, orange ones represent interaction between H9N2 and H7N9 viruses; while the blue dot lines, dash-dot lines and solid lines with arrow indicate the viral migration pattern of H7N9 in wave 1, wave 2 and persist during two epidemic waves, respectively. The linkage strength is represented by the number of occurrence in all internal segments. Locations with H7N9 human cases included in the study are colored and those not included are shaded gray. The primary national roads and cities with H7N9 human cases are represented by black lines and black dots, respectively. J-J-J, Beijing–Tianjin–Hebei region; SD, Shandong; JS, Jiangsu; SH-ZJ, Shanghai–Zhejiang region; JX, Jiangxi; GD, Guangdong.

