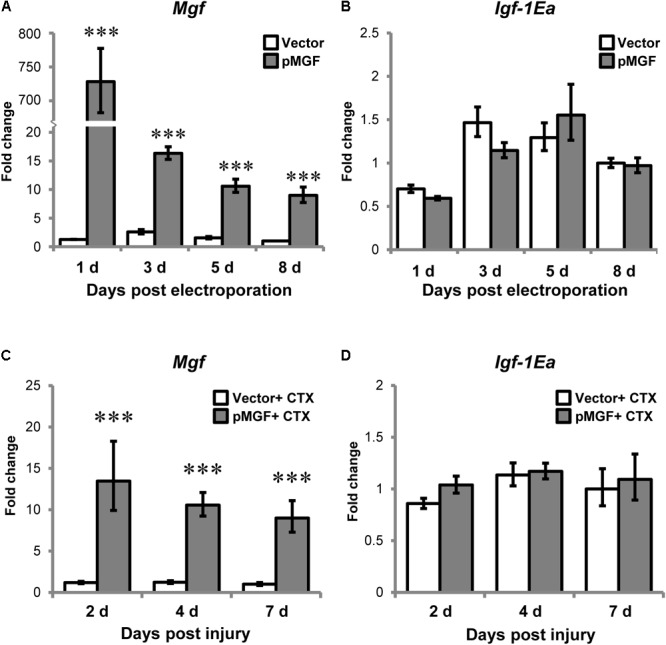
FIGURE 4.

Specific overexpression of MGF in pMGF-electroporated muscles. The expression of (A) Mgf and (B) Igf-1Ea in pMGF-electroporated muscles harvested from 1 to 8 days post-electroporation (n = 5/treatment/timepoint). This is relative to 8 days vector. Significant difference between vector and pMGF: ∗∗∗P < 0.001. The expression of (C) Mgf and (D) Igf-1Ea in pMGF-electroporated CTX-injured muscles harvested from 2 to 7 days post-injury (n = 6/treatment/timepoint). This is relative to 7 days vector + CTX. Significant difference between vector + CTX and pMGF + CTX: ∗∗∗P < 0.001. The geometric mean of Gapdh, 18S rRNA, and Rsp20 expression served as the internal control. Statistics were analyzed by two-way ANOVA and followed by Bonferroni test. Values represent mean ± SEM.
