
FIGURE 9.
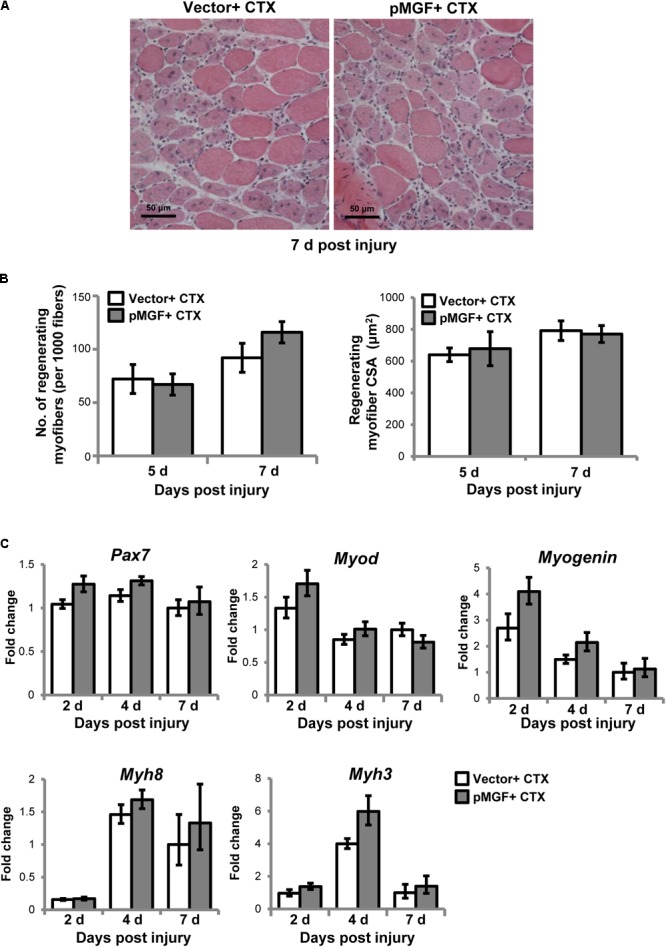
Muscle regeneration outcomes in MGF-overexpressing CTX-injured muscles. (A) Hematoxylin and eosin staining of muscles harvested at 7 days post-injury. Scale = 50 μm. (B) The number and cross-sectional area (CSA) of centrally nucleated myofibers (n = 4/treatment/timepoint). Values represent mean ± SEM. (C) Expression of genes related to muscle regeneration. Samples were collected from 2 to 7 days post-injury (n = 6/treatment/timepoint). The investigated genes included Pax7, Myod, Myogenin, Myh3, and Myh8. The geometric mean of Gapdh, 18S rRNA, and Rsp20 expression served as the internal control. The expression level is relative to that of 7 days vector + CTX. Statistics were analyzed by two-way ANOVA and followed by Bonferroni test. Values represent mean ± SEM.