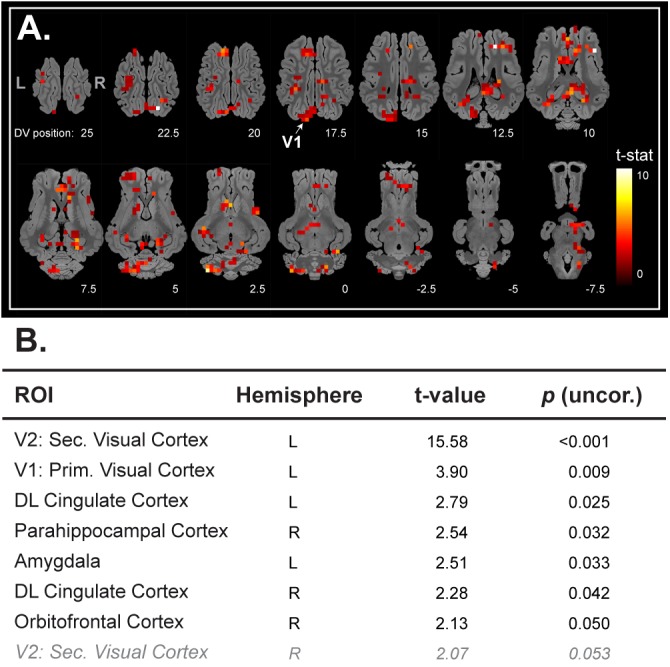
FIGURE 1.

(A) Horizontal maps of global brain BOLD responses to a visual stimulation (white flash, 8 Hz). p-Value threshold = 0.05; DV, dorsal-ventral position in mm related to the posterior commissure. (B) Related ROI-based statistical analysis with ROIs from Saikali atlas (Saikali et al., 2010). ROI abbreviations are detailed at the bottom of the panel (A). Cerebellar brain ROIs were excluded, p-values <0.05 are presented in black normal font style, and p-value between 0.05 and 0.1 are presented in gray italic.
