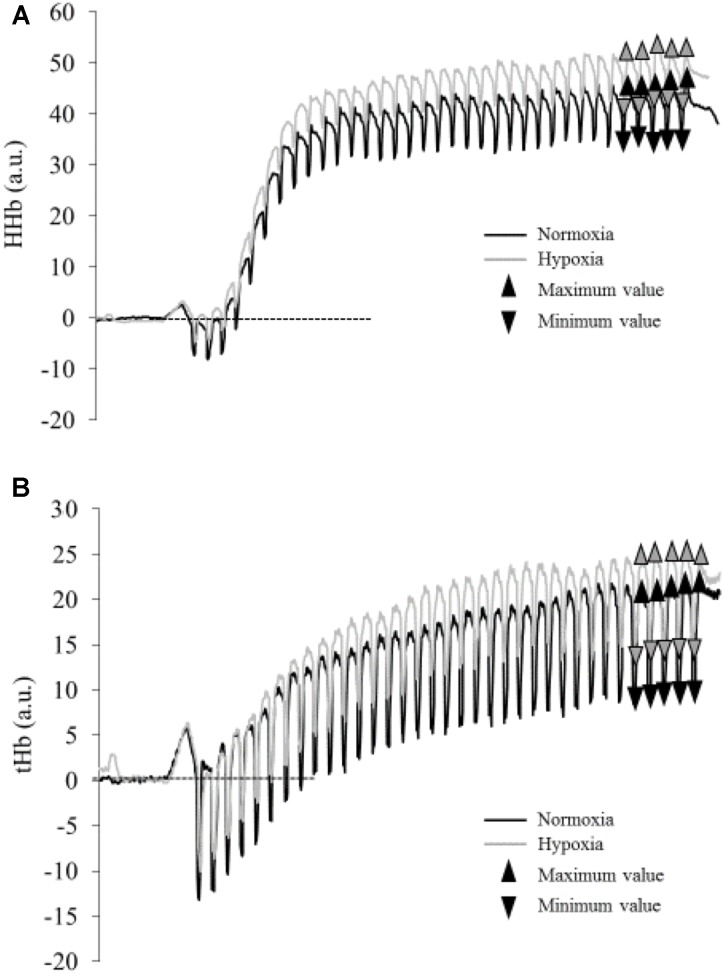
FIGURE 1.
Typical traces of deoxyhemoglobin concentration [HHb] (A) and total hemoglobin (tHb) (B) during the fatiguing protocol in normoxia (black line) and hypoxia (gray line) for one subject. Triangles represent maximal and minimal values measured during the last five contractions (mean values are presented in Table 1).

