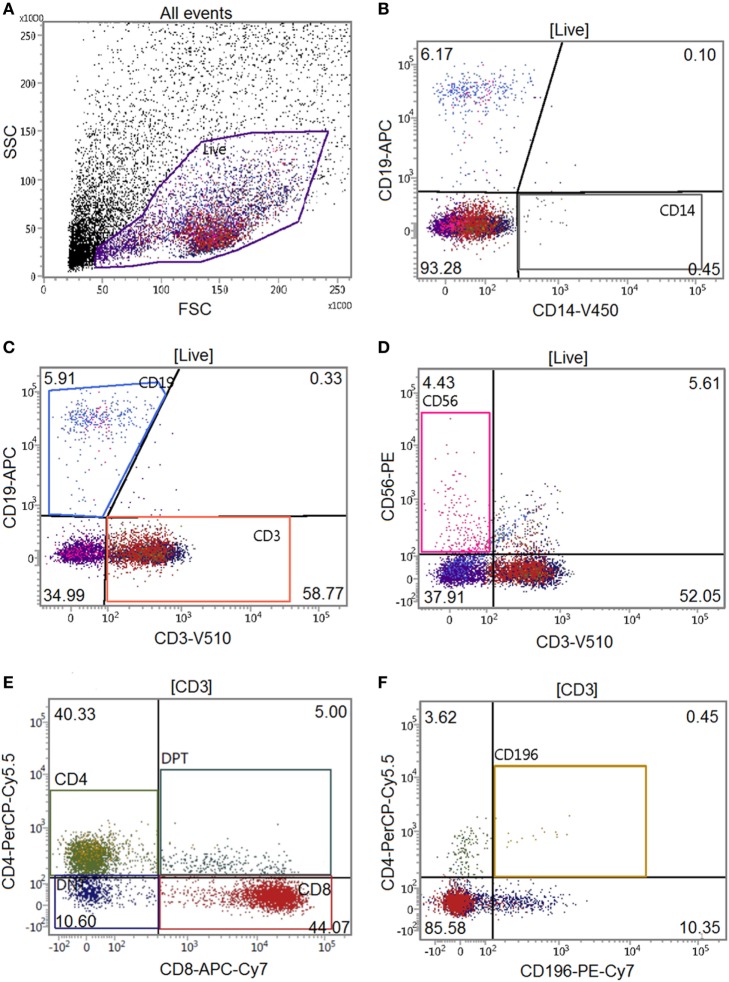
Figure 1.
Gating tree of flow cytometry experiments. The antibody combination for flow cytometric experiments was CD14-V450/CD19-APC/CD3-V500/CD56-PE/CD4-PerCPCy5.5/CD8-APC-Cy7/CD196-PE-Cy7 (Table 1). Acquisition and analysis were performed on a BD FACSverse flow cytometer using associated FACSuite software. The number in quadrants indicate percentages of cells in the corresponding gating. The gating tree was set as follows: (A) forward scatter/sideward scatter represents the distribution of cells in the light scatter based on size and intracellular composition, respectively, where the live population is encircled in purple. In the “live” population, (B) CD14+, (C) CD19+, CD3+, (D) CD56+CD3− cells were identified. In the CD3+ gating, (E) CD4+, CD8+, and (F) CD196+ populations were identified. Here, a characterization of a gingival fibroblast-peripheral blood mononuclear cell coculture after 21 days is shown.

